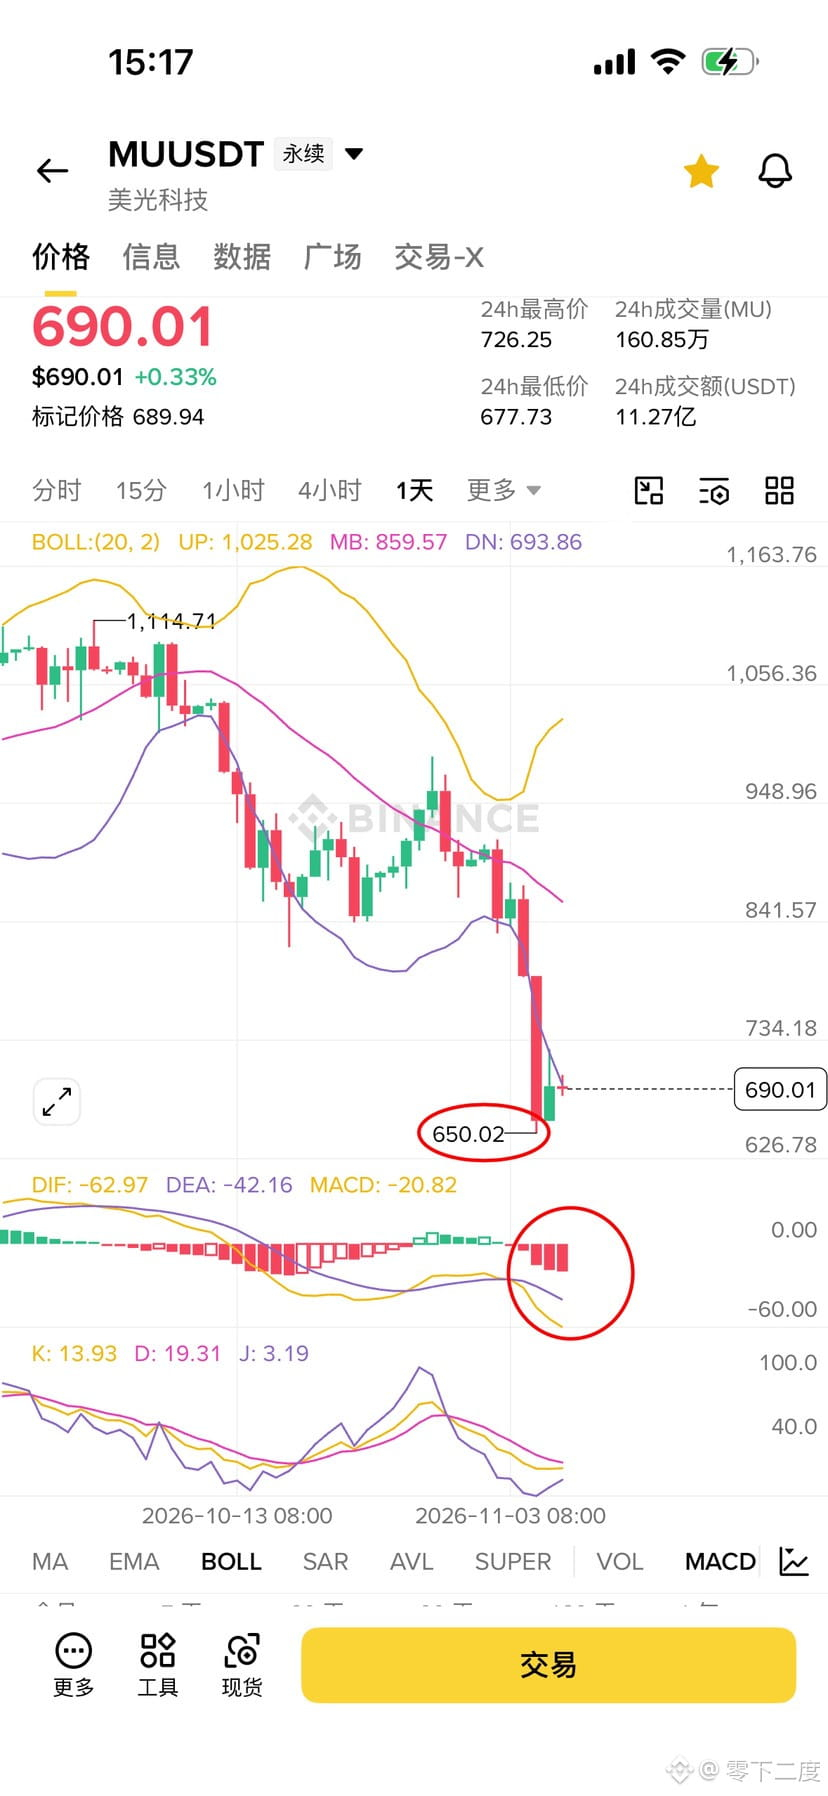
Micron: The night before last, I identified a low-long entry near 655 on the pullback; the price actually reached 650. 650 is this week’s low and also one of the monthly-chart support levels. Those who attended the July–August lessons can use the previous method to find the corresponding indicator, and then you’ll understand which indicator I’m watching and how I identified in advance that the pullback could reach this low.
The highs are still moving lower, and so are the lows. Support at 650 has moved down to 640, so if we break below 640 or 636 next week, we could see 5. If 640 holds, any rebound above 700 before then is an opportunity to take profit on short positions between 682 and 666. Yesterday’s rebound into the evening was the result of slowing downside momentum over the 8- and 12-hour periods. That’s why entering a short around 720–726 during last night’s rebound meant shorting near the high, making it relatively easy to profit. So far, the daily chart still shows no signal that the decline is slowing, so 720–726 remains resistance on a rebound. Once the daily chart signals that the decline is weakening, resistance will be at 746/750. That’s only 20 points above the 12-hour resistance, so if the price reaches around 747, you can add to your short position.
The market may move sideways over the weekend, but next week will still be a period of larger swings.
The highs are still moving lower, and so are the lows. Support at 650 has moved down to 640, so if we break below 640 or 636 next week, we could see 5. If 640 holds, any rebound above 700 before then is an opportunity to take profit on short positions between 682 and 666. Yesterday’s rebound into the evening was the result of slowing downside momentum over the 8- and 12-hour periods. That’s why entering a short around 720–726 during last night’s rebound meant shorting near the high, making it relatively easy to profit. So far, the daily chart still shows no signal that the decline is slowing, so 720–726 remains resistance on a rebound. Once the daily chart signals that the decline is weakening, resistance will be at 746/750. That’s only 20 points above the 12-hour resistance, so if the price reaches around 747, you can add to your short position.
The market may move sideways over the weekend, but next week will still be a period of larger swings.