
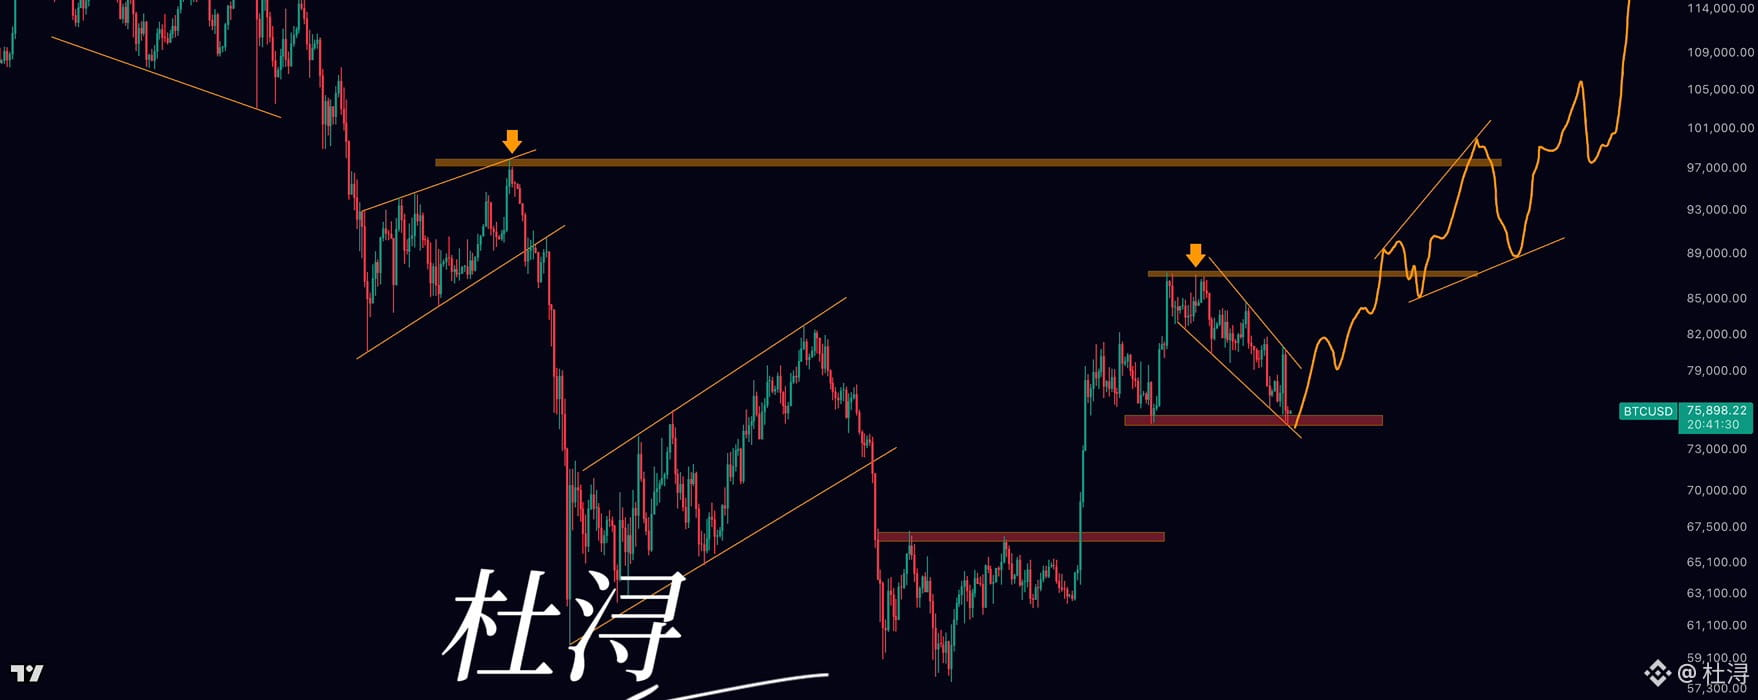

Hello, everyone! I'm Du Xun! There's currently a lot of disagreement in the market. The price is now between 75,000 and 76,000, a key dividing line. This level is very important. Some people see risk here, while others see opportunity. Let me share my take on the current market structure.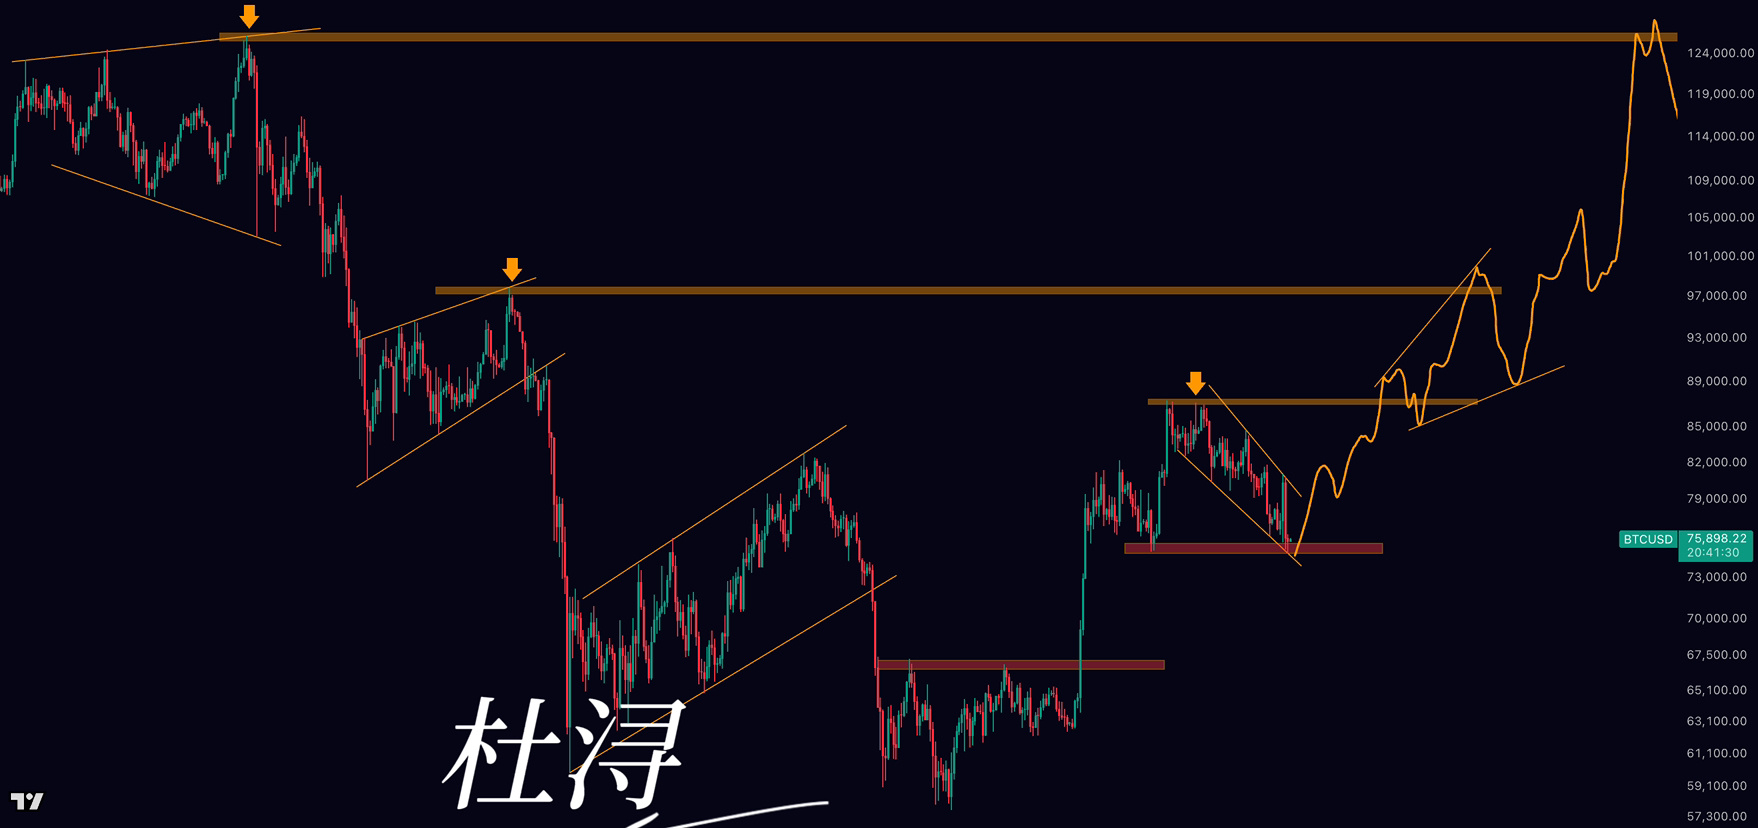
First, let's start with the shorter time frame and take a look at the 15-minute chart. From yesterday through today, the market has been moving sideways in a narrow range near the bottom, with very little volatility. It's the weekend, so tomorrow's price action will most likely be similar. Generally speaking, though, the direction of Sunday's price movement determines the main direction of the market on Monday and Tuesday of the following week. You can do a quick review by observing the direction of price movements on Saturdays and Sundays over the past few weeks. In most cases, Monday and Tuesday continue in that direction, but this doesn't determine the price trend for the entire following week. So, if the market consolidates over the weekend and then breaks above 76,000 and reaches levels like 77,000, I think there's a chance that the decline will bottom out next week, followed by a rebound.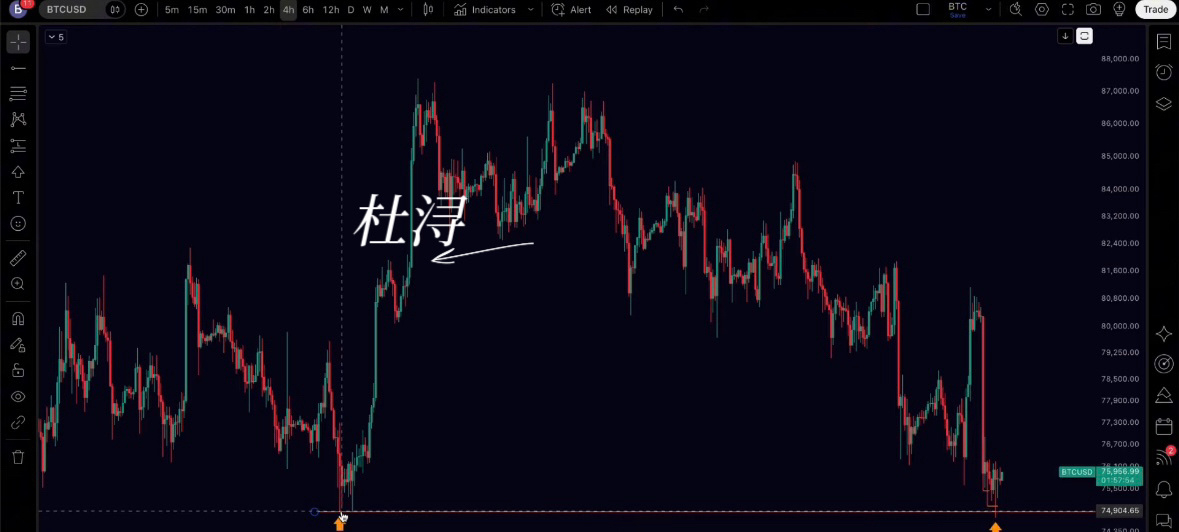
On the 15-minute timeframe, we can see that the low ahead has been broken consecutively, while the consolidation highs have been gradually moving lower. So, on the 15-minute timeframe, the price action we’re seeing still reflects a downtrend. Last night, there was a downward wick, and its low was right around 74,700–74,800. That 74,700–74,800 area is actually where the previous daily-timeframe correction bottomed out. It’s a key low that most analysts and traders in the market are watching closely. After briefly breaking below this low, the price has now recovered above it. The previous low was at 74,900, while last night’s low on the spot exchange was 74,700. After dipping slightly below, the price has now recovered.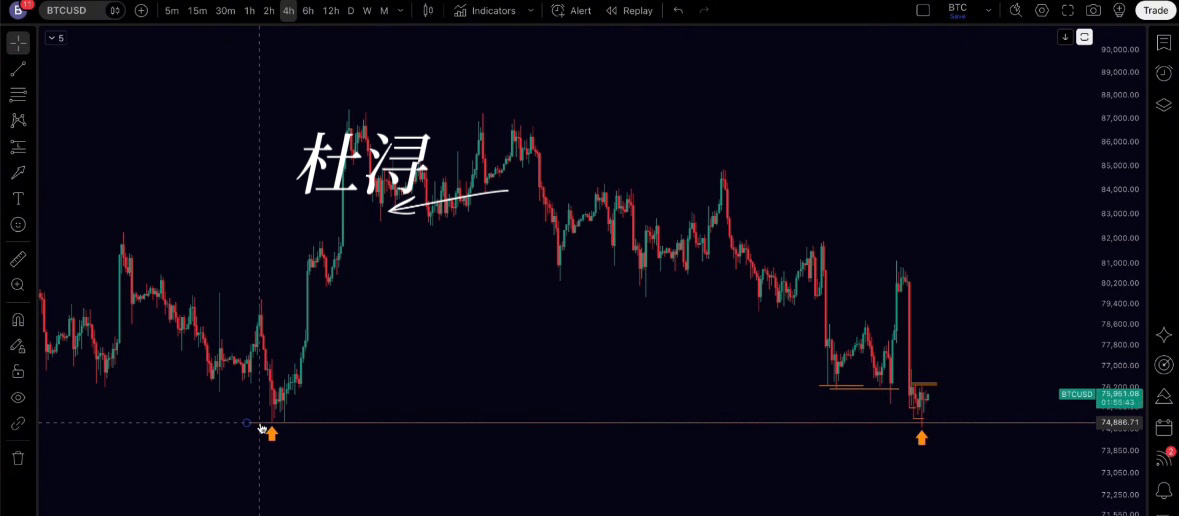
On the four-hour chart, we can see consecutive doji candles at this level, followed by repeated breaks below the preceding lows. Looking at the four-hour chart, the price has also broken below those earlier lows and then recovered. What impression does this price action give? That the price can’t seem to break lower. If this area is the neckline of the multiple bottom formed before the rally toward 81,800, then it could complete this recovery. But the key thing to watch is whether price can break through the critical resistance at 76,300 above the 15-minute timeframe. So there’s considerable disagreement in the market right now. I think we need to keep watching for a clear confirmation signal. At this point, I believe both risk and opportunity are present. The 75,000 level below is extremely important, but if it breaks, the downside could be greater than people expect.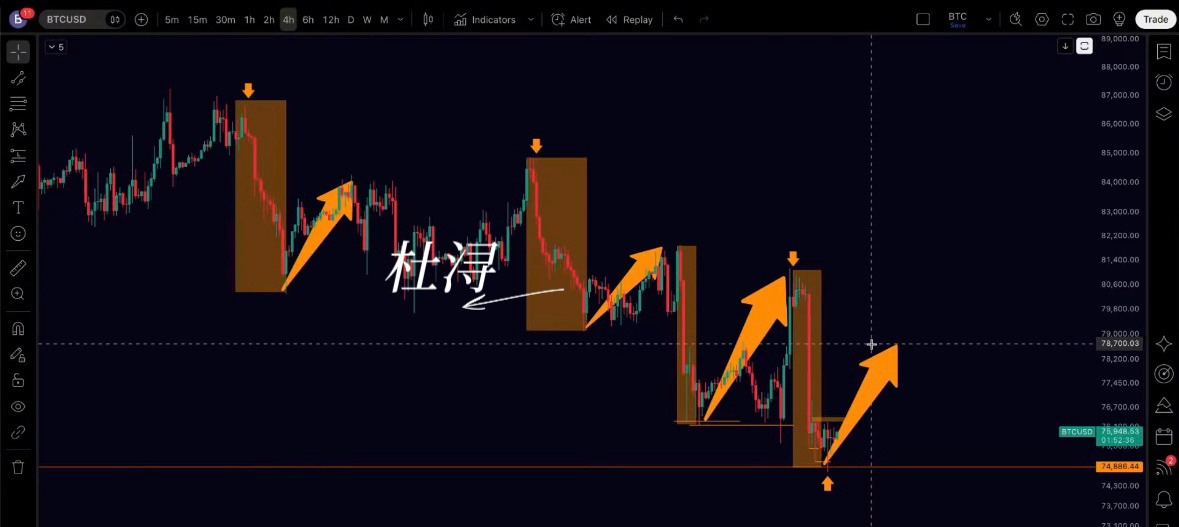
There is still risk in the market, and for now the downside risk has not been eliminated. We need to see a short-term structure develop. At a minimum, we need to see price break through key resistance on the 15-minute and minute charts before we can confirm a signal that the decline has stopped. That still wouldn’t be a reversal signal; it would only confirm that the decline has stopped. So I think this level needs close monitoring. We’re essentially at a critical inflection point, and the next move will determine the direction. The current price action needs to form a structure that will provide an answer. So next week will largely determine the direction for the coming period. This is very important, so keep a close eye on today’s and tomorrow’s consolidation. If the consolidation breaks out of its structure, that should give us a good indication of the most likely direction next week. That’s my view for now.