$ACT – Technical analysis
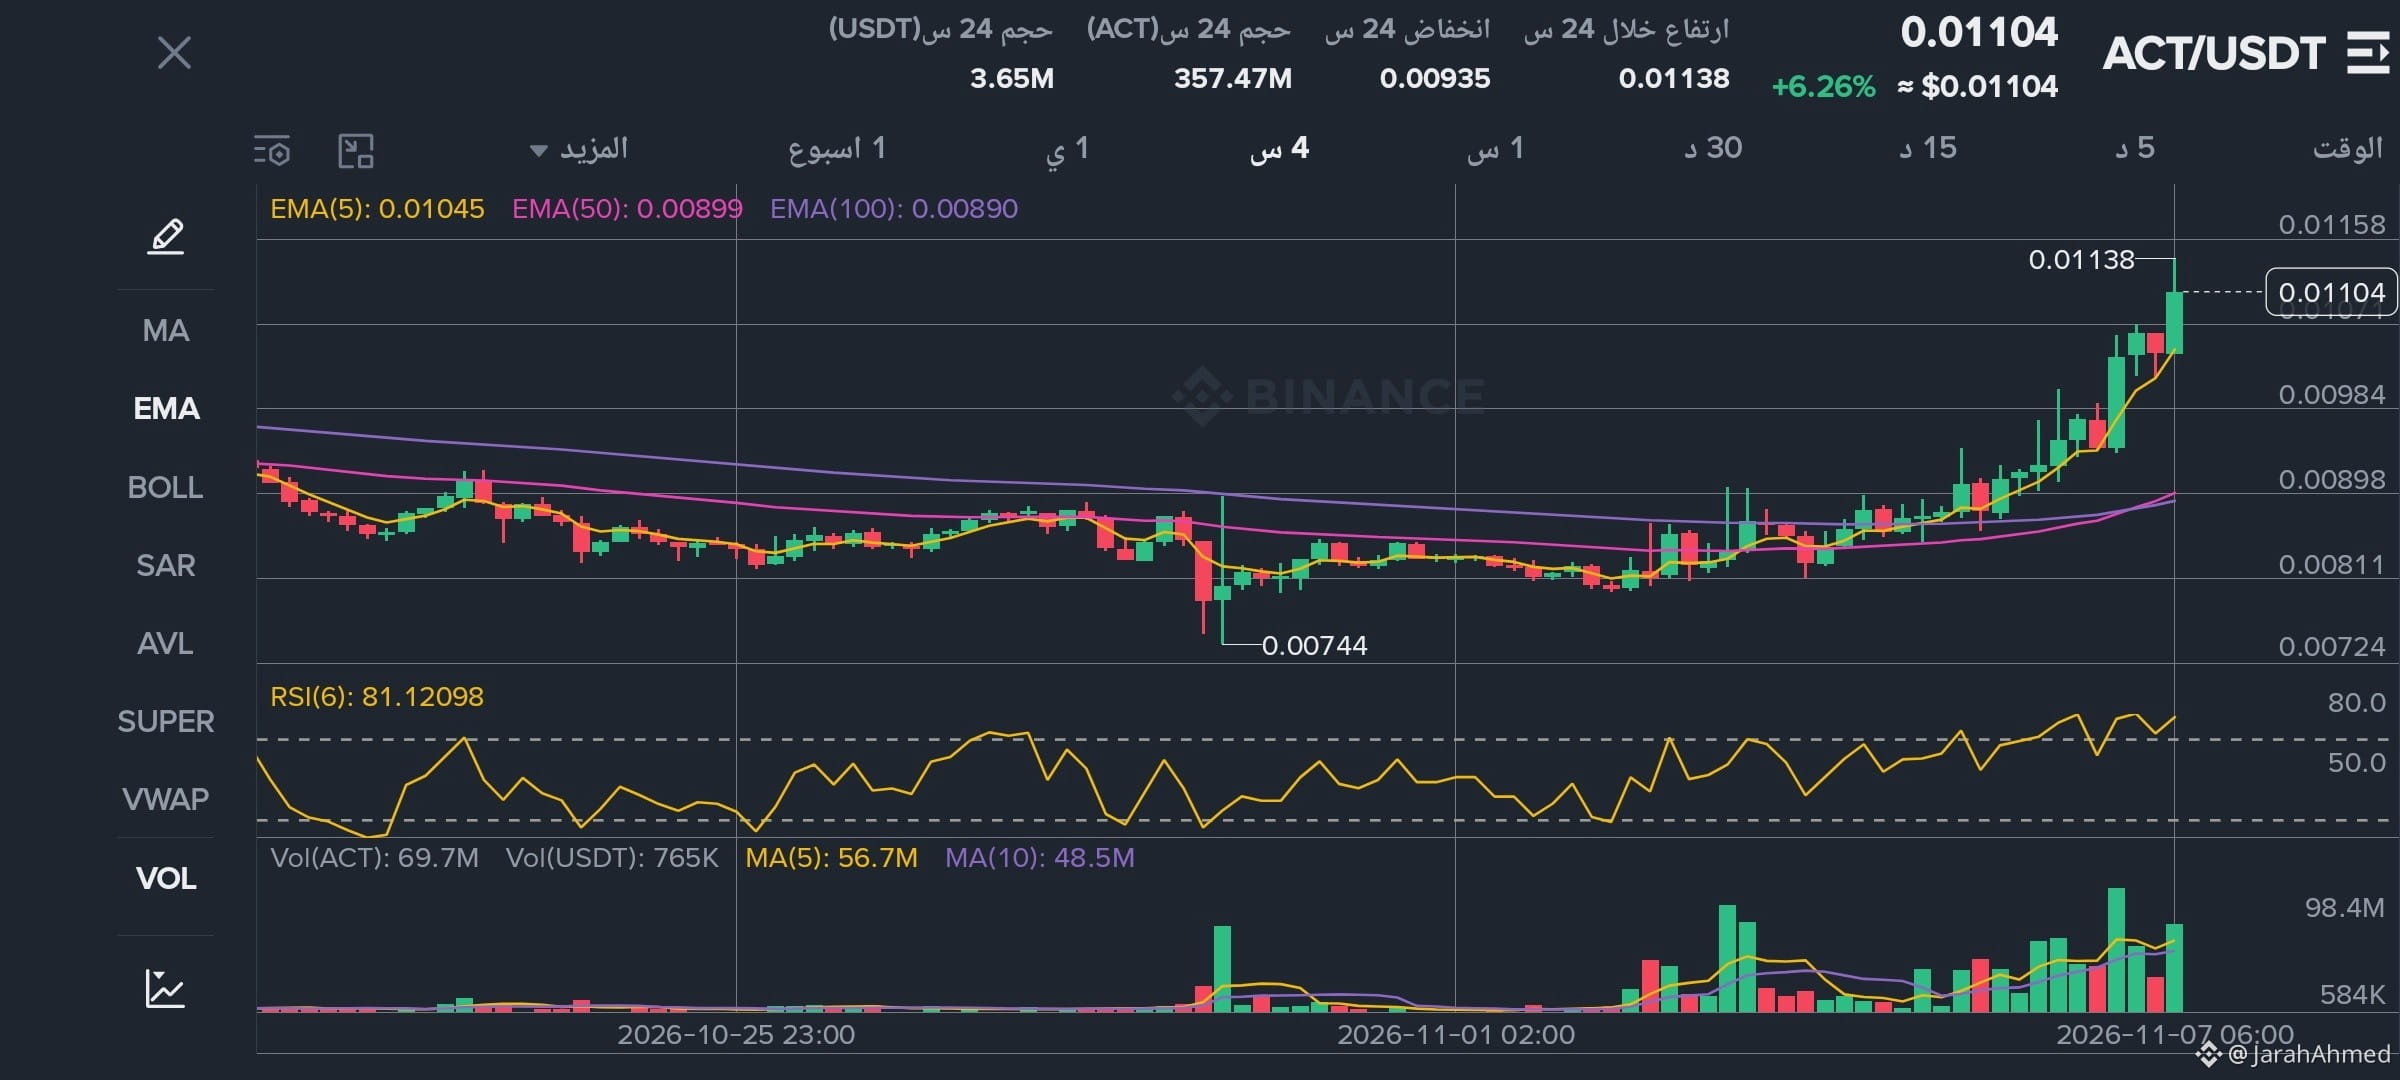
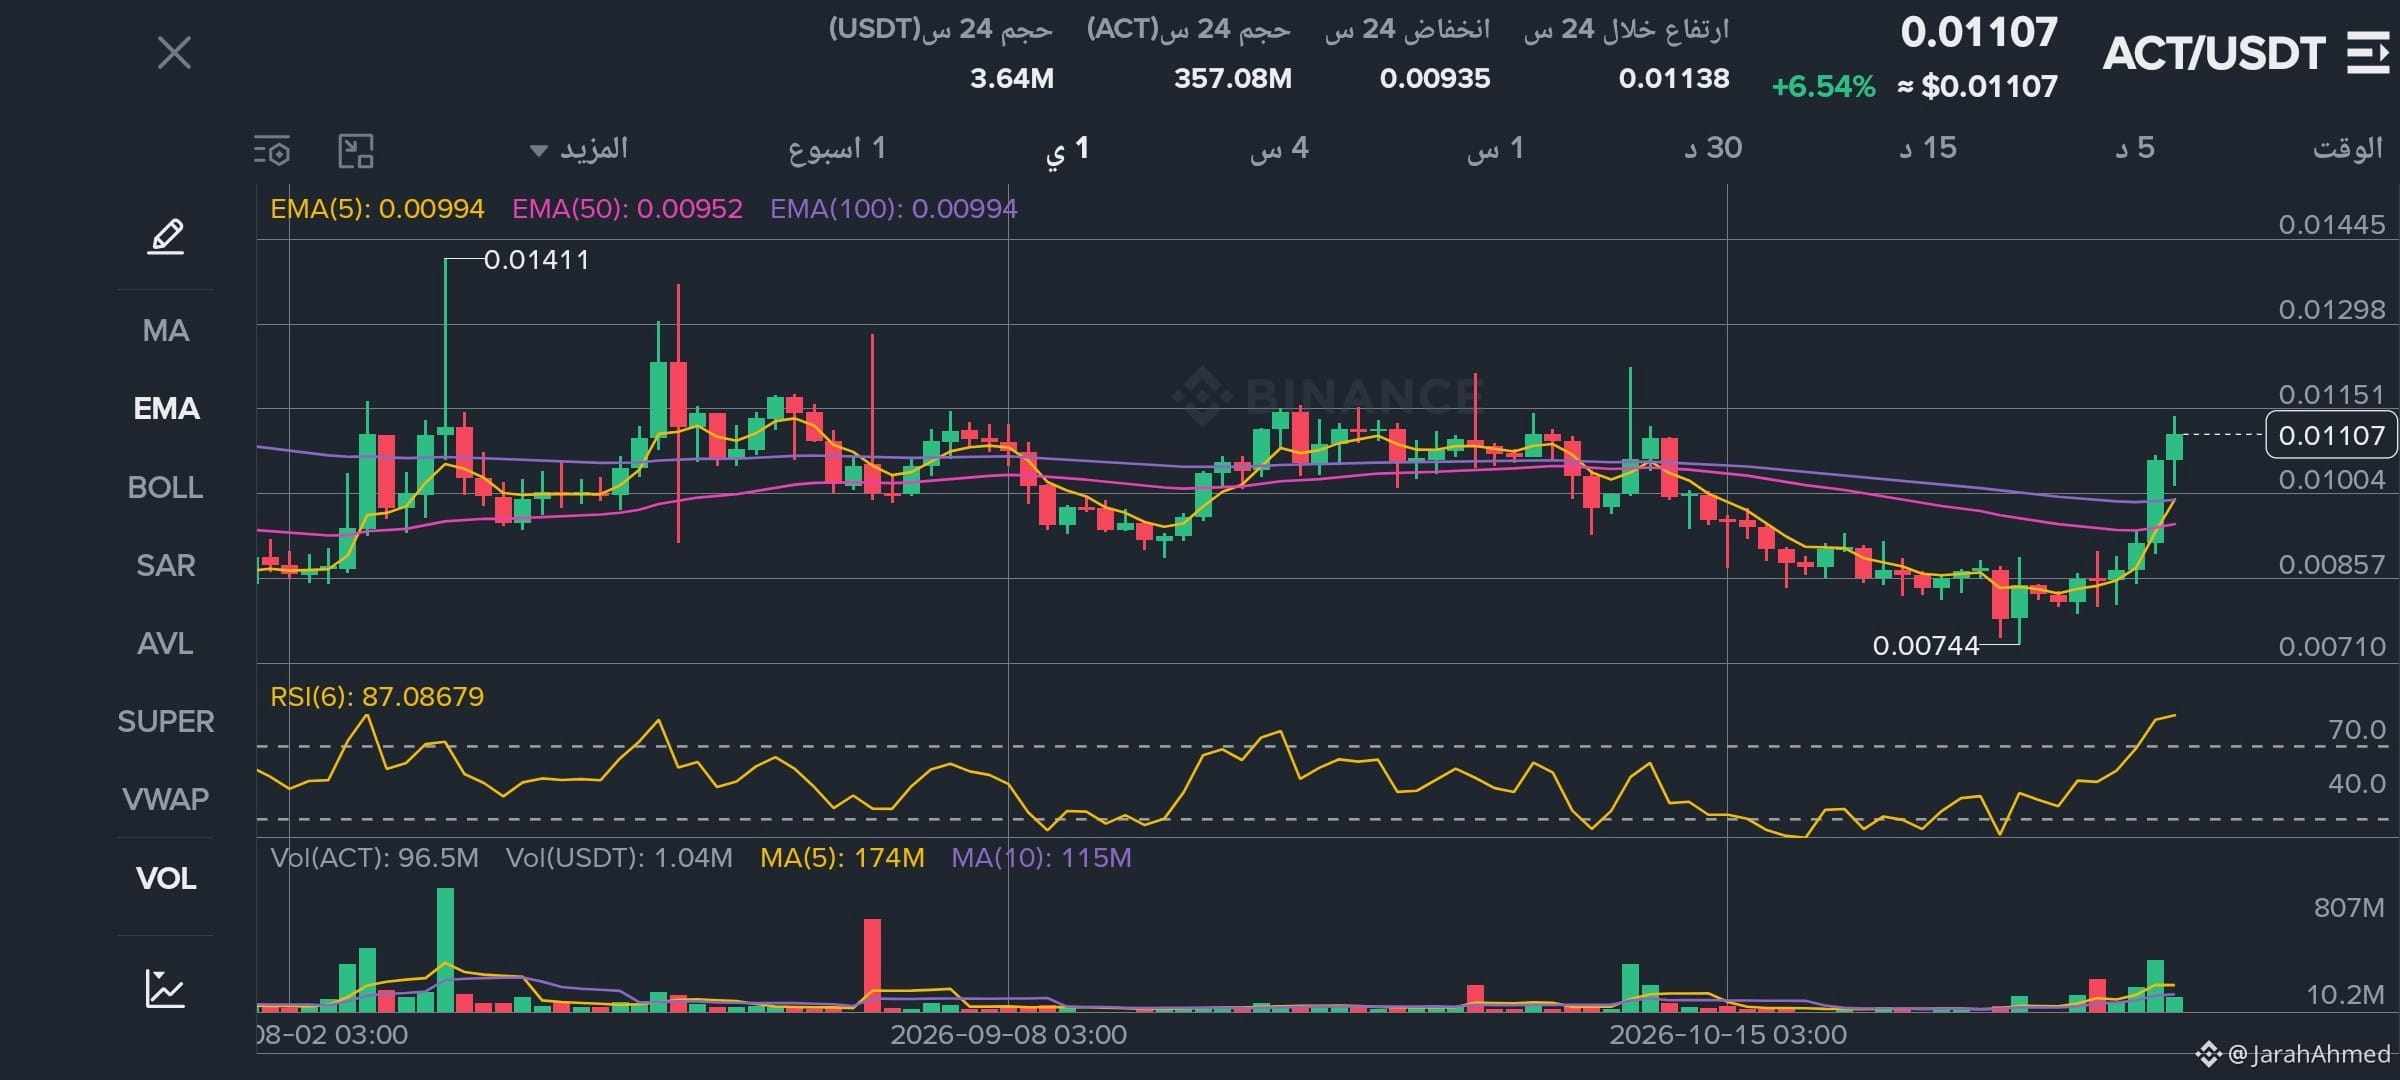
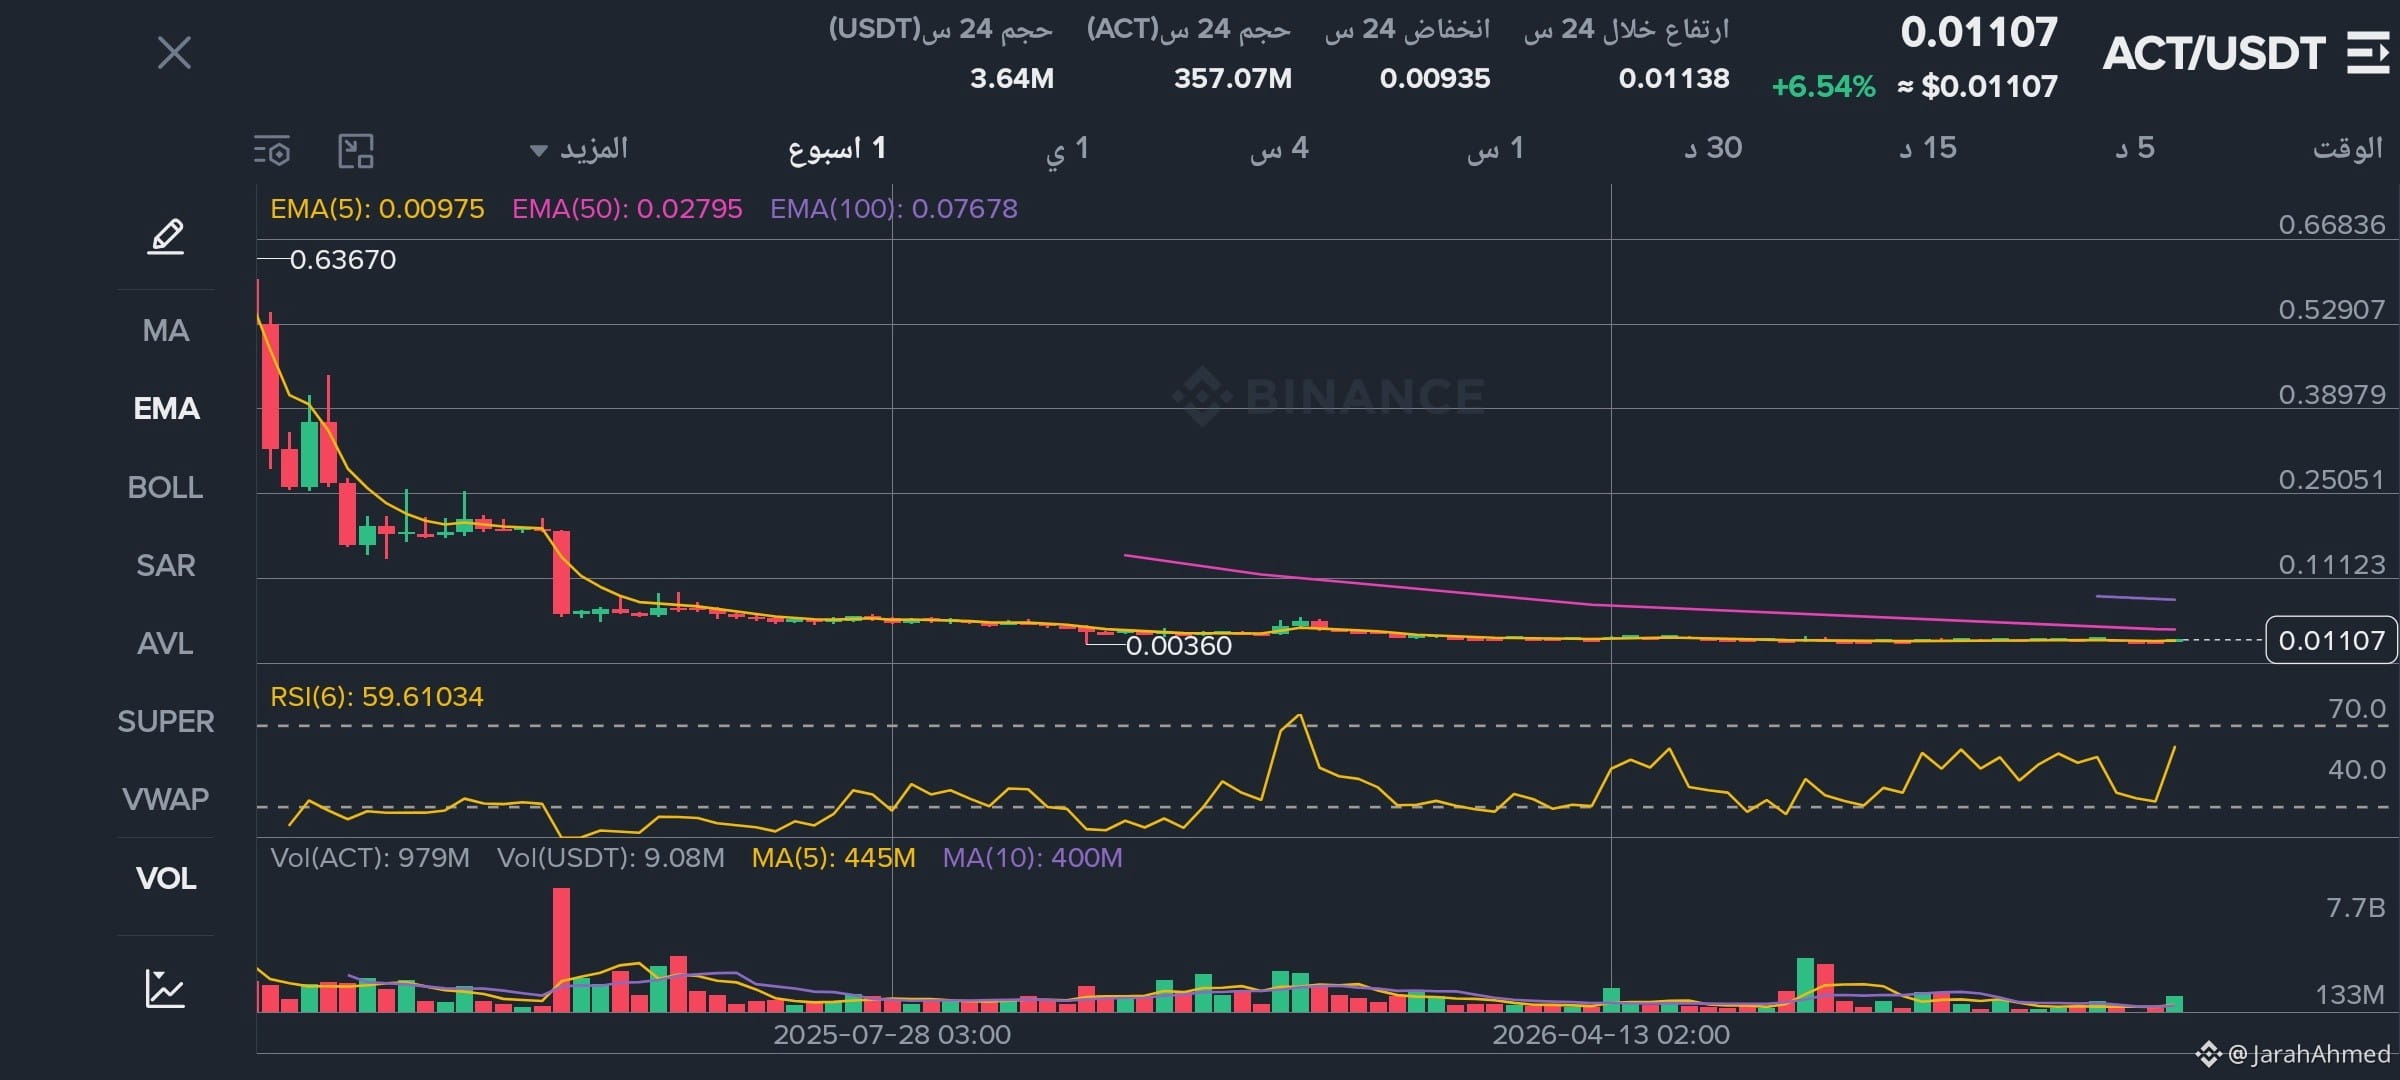
1\. Overall trend: bearish in the long term, but strongly bullish on the daily and 4-hour timeframes, with a clear rebound.
2\. Important patterns and candlesticks: bullish breakout from a previous accumulation zone, accompanied by a notable increase in trading volume. No clearly completed classical pattern is visible.
3\. Entry point: 0.01000 – 0.01045 after a correction and confirmation of the rebound.
4\. Stop loss: 0.00930.
5\. First target: 0.01138.
6\. Second target: 0.01411.
$ACT
Very high on the daily and 4-hour timeframes
1\. Overall trend: bearish in the long term, but strongly bullish on the daily and 4-hour timeframes, with a clear rebound.
2\. Important patterns and candlesticks: bullish breakout from a previous accumulation zone, accompanied by a notable increase in trading volume. No clearly completed classical pattern is visible.
3\. Entry point: 0.01000 – 0.01045 after a correction and confirmation of the rebound.
4\. Stop loss: 0.00930.
5\. First target: 0.01138.
6\. Second target: 0.01411.
$ACT
Very high on the daily and 4-hour timeframes