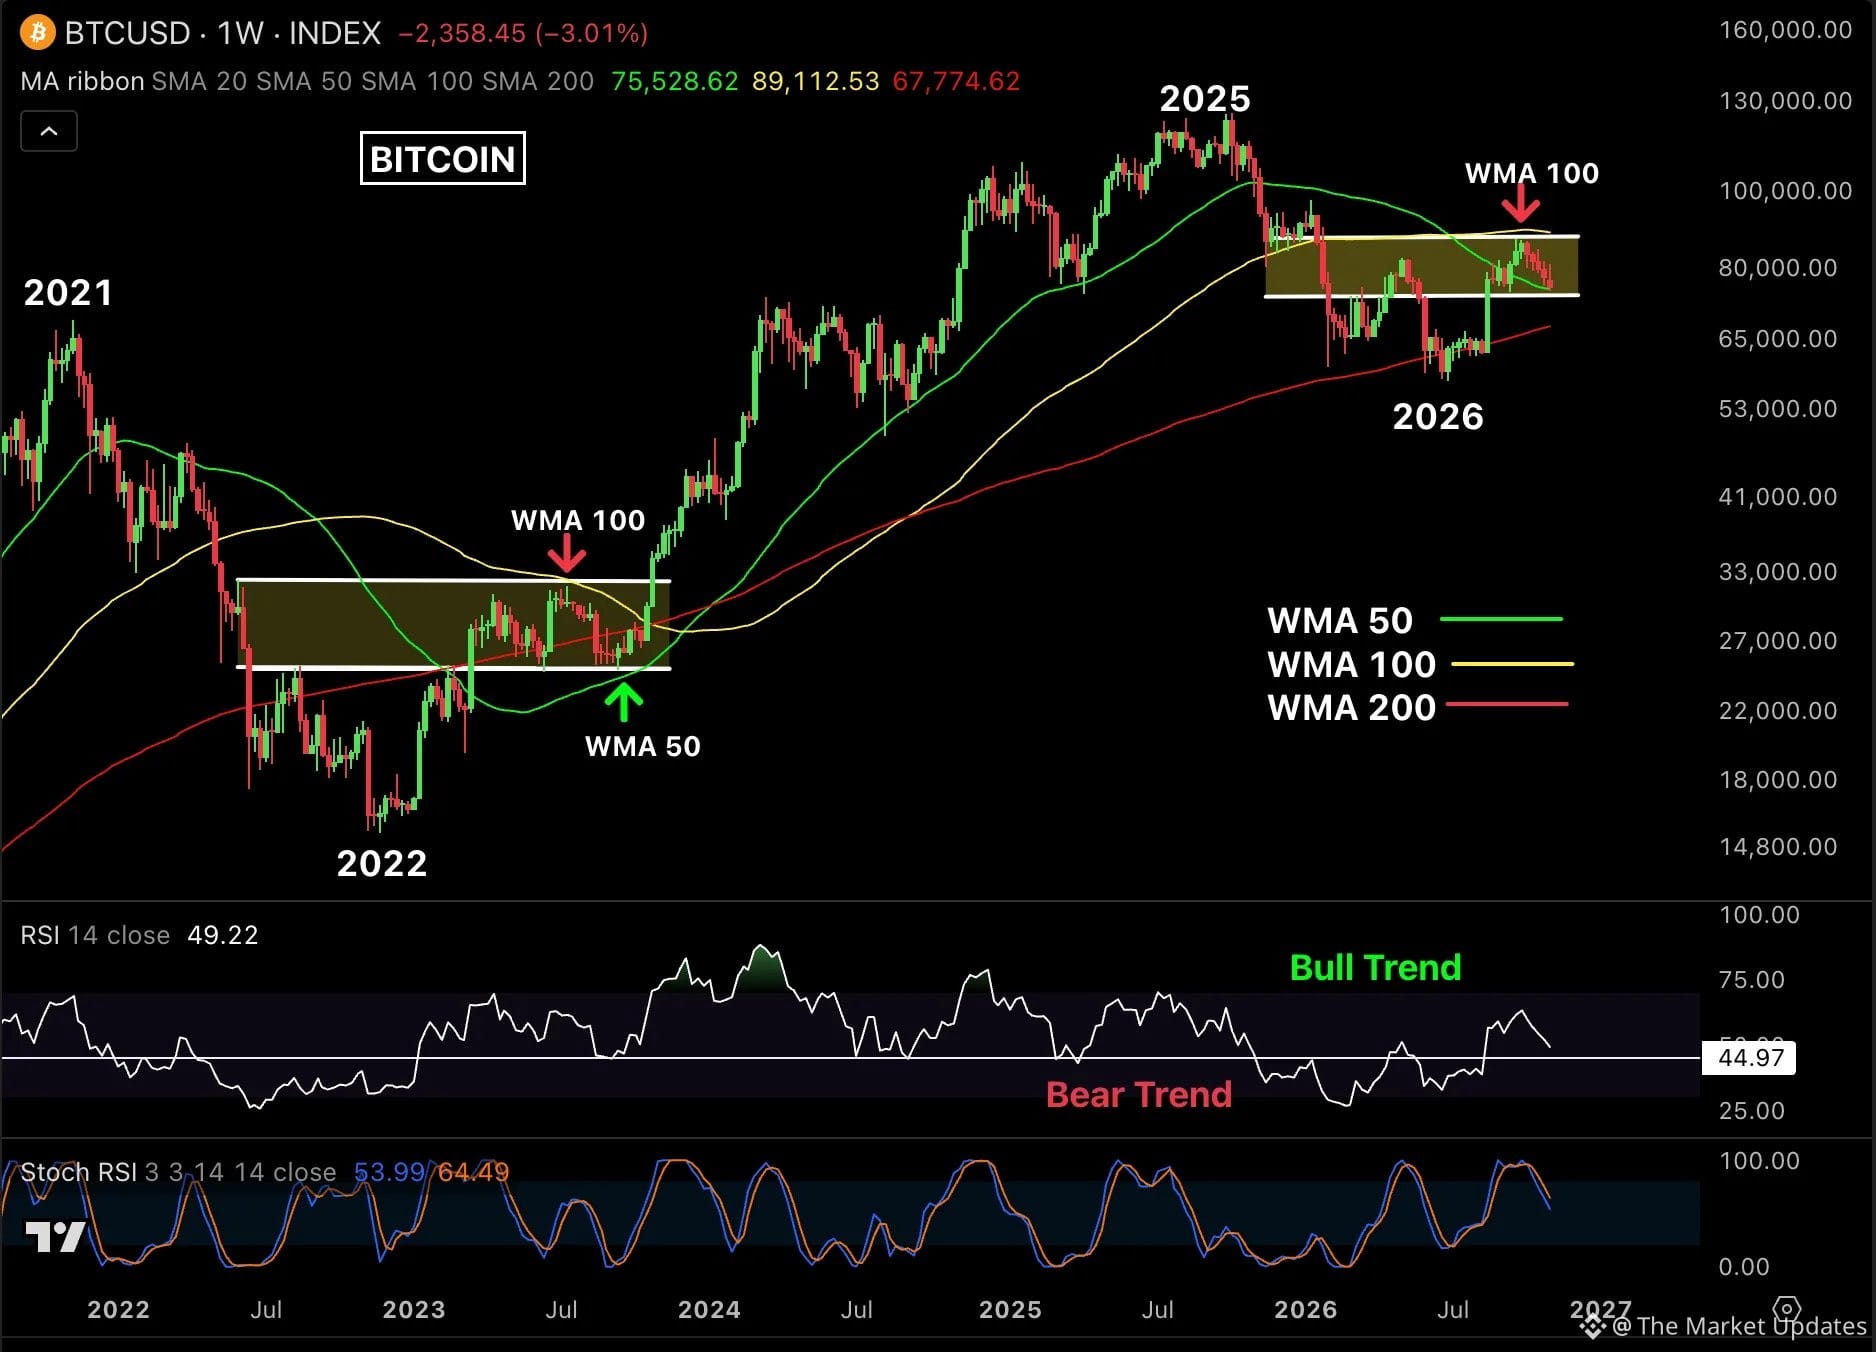
Bitcoin is showing a familiar setup on the weekly chart.
We saw something similar in 2023, when BTC consolidated between the weekly MA 50 and MA 100 before breaking out and starting its next major rally.
Now in 2026, Bitcoin is once again trading between these two moving averages after getting rejected from the weekly MA 100 near $87,400.
Here's what I'm watching:
Support: Weekly MA 50 at $75,500 and MA 200 at $67,800.
Resistance: $82,000, followed by the weekly MA 100 near $87,400.
RSI: Near 50 and still above the bear market zone.
Stochastic RSI: Looking weak, with room for RSI to drop toward 44 before another move higher.
The similarities to 2023 are hard to ignore.
If Bitcoin reclaims the weekly MA 100 and holds above it, we could see another major rally.
But first, Bitcoin needs to hold its support.
We saw something similar in 2023, when BTC consolidated between the weekly MA 50 and MA 100 before breaking out and starting its next major rally.
Now in 2026, Bitcoin is once again trading between these two moving averages after getting rejected from the weekly MA 100 near $87,400.
Here's what I'm watching:
Support: Weekly MA 50 at $75,500 and MA 200 at $67,800.
Resistance: $82,000, followed by the weekly MA 100 near $87,400.
RSI: Near 50 and still above the bear market zone.
Stochastic RSI: Looking weak, with room for RSI to drop toward 44 before another move higher.
The similarities to 2023 are hard to ignore.
If Bitcoin reclaims the weekly MA 100 and holds above it, we could see another major rally.
But first, Bitcoin needs to hold its support.