Bitcoin tests the weekly support: $75,200 will decide the next move 📉
SITUATION
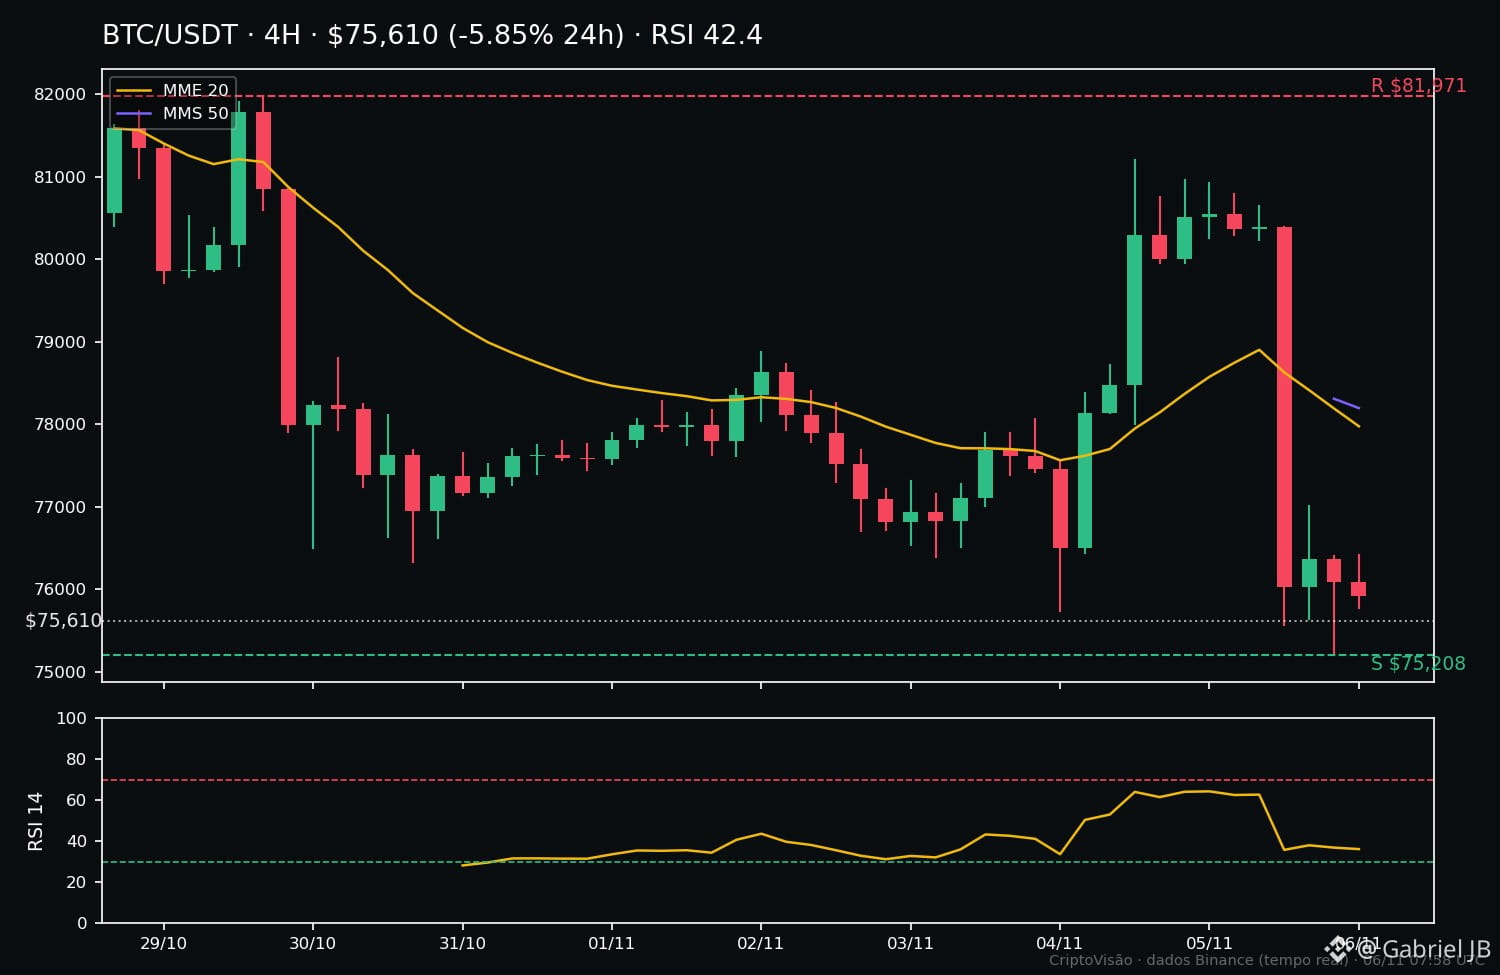
$BTC fell 5.85% in the last 24 hours and is now trading at $75,615, right around the weekly low ($75,208). Over 7 days, the cumulative decline is 6.95%. The price is below the 20- and 50-period moving averages on the 4-hour chart ($78,002 and $78,195) — a weakening short-term trend — and the RSI-14 is at 42.4, neutral, with no oversold signal.
LEVELS
• Support: $75,208 (weekly and 24-hour low)
• Resistance: $78,000–$78,200 (moving average zone)
• Resistance: $81,971 (weekly high)
SCENARIO A — support holds
If the price defends $75,208 with a 4-hour candle close above that level and recovers $78,000, there’s room for a rebound toward $81,971.
SCENARIO B — support breaks
If a 4-hour candle closes below $75,208, the recovery scenario is invalidated, leaving room for the price to test levels below the weekly low.
WHAT WOULD CONFIRM IT
A 4-hour candle close — not a wick — above $78,000 would confirm buying strength; a close below $75,208 would confirm the loss of support.
RISK
The price is right at the weekly low, with $2.08 billion in volume over the last 24 hours. Entering here without confirmation is like trying to catch a falling knife: volatility could push the price either way before a direction is established.
CONCLUSION
This is a decision zone, not a certainty. The level to watch is clear: $75,208. Those following $BTC : do you think support will hold, or will we see new lows this week? 👇
$BTC #Bitcoin #CriptoVisao
SITUATION
$BTC fell 5.85% in the last 24 hours and is now trading at $75,615, right around the weekly low ($75,208). Over 7 days, the cumulative decline is 6.95%. The price is below the 20- and 50-period moving averages on the 4-hour chart ($78,002 and $78,195) — a weakening short-term trend — and the RSI-14 is at 42.4, neutral, with no oversold signal.
LEVELS
• Support: $75,208 (weekly and 24-hour low)
• Resistance: $78,000–$78,200 (moving average zone)
• Resistance: $81,971 (weekly high)
SCENARIO A — support holds
If the price defends $75,208 with a 4-hour candle close above that level and recovers $78,000, there’s room for a rebound toward $81,971.
SCENARIO B — support breaks
If a 4-hour candle closes below $75,208, the recovery scenario is invalidated, leaving room for the price to test levels below the weekly low.
WHAT WOULD CONFIRM IT
A 4-hour candle close — not a wick — above $78,000 would confirm buying strength; a close below $75,208 would confirm the loss of support.
RISK
The price is right at the weekly low, with $2.08 billion in volume over the last 24 hours. Entering here without confirmation is like trying to catch a falling knife: volatility could push the price either way before a direction is established.
CONCLUSION
This is a decision zone, not a certainty. The level to watch is clear: $75,208. Those following $BTC : do you think support will hold, or will we see new lows this week? 👇
$BTC #Bitcoin #CriptoVisao