Break

Post


CryptoChan 熊猫
·
--
【 $BTC four-year cycle series 86】
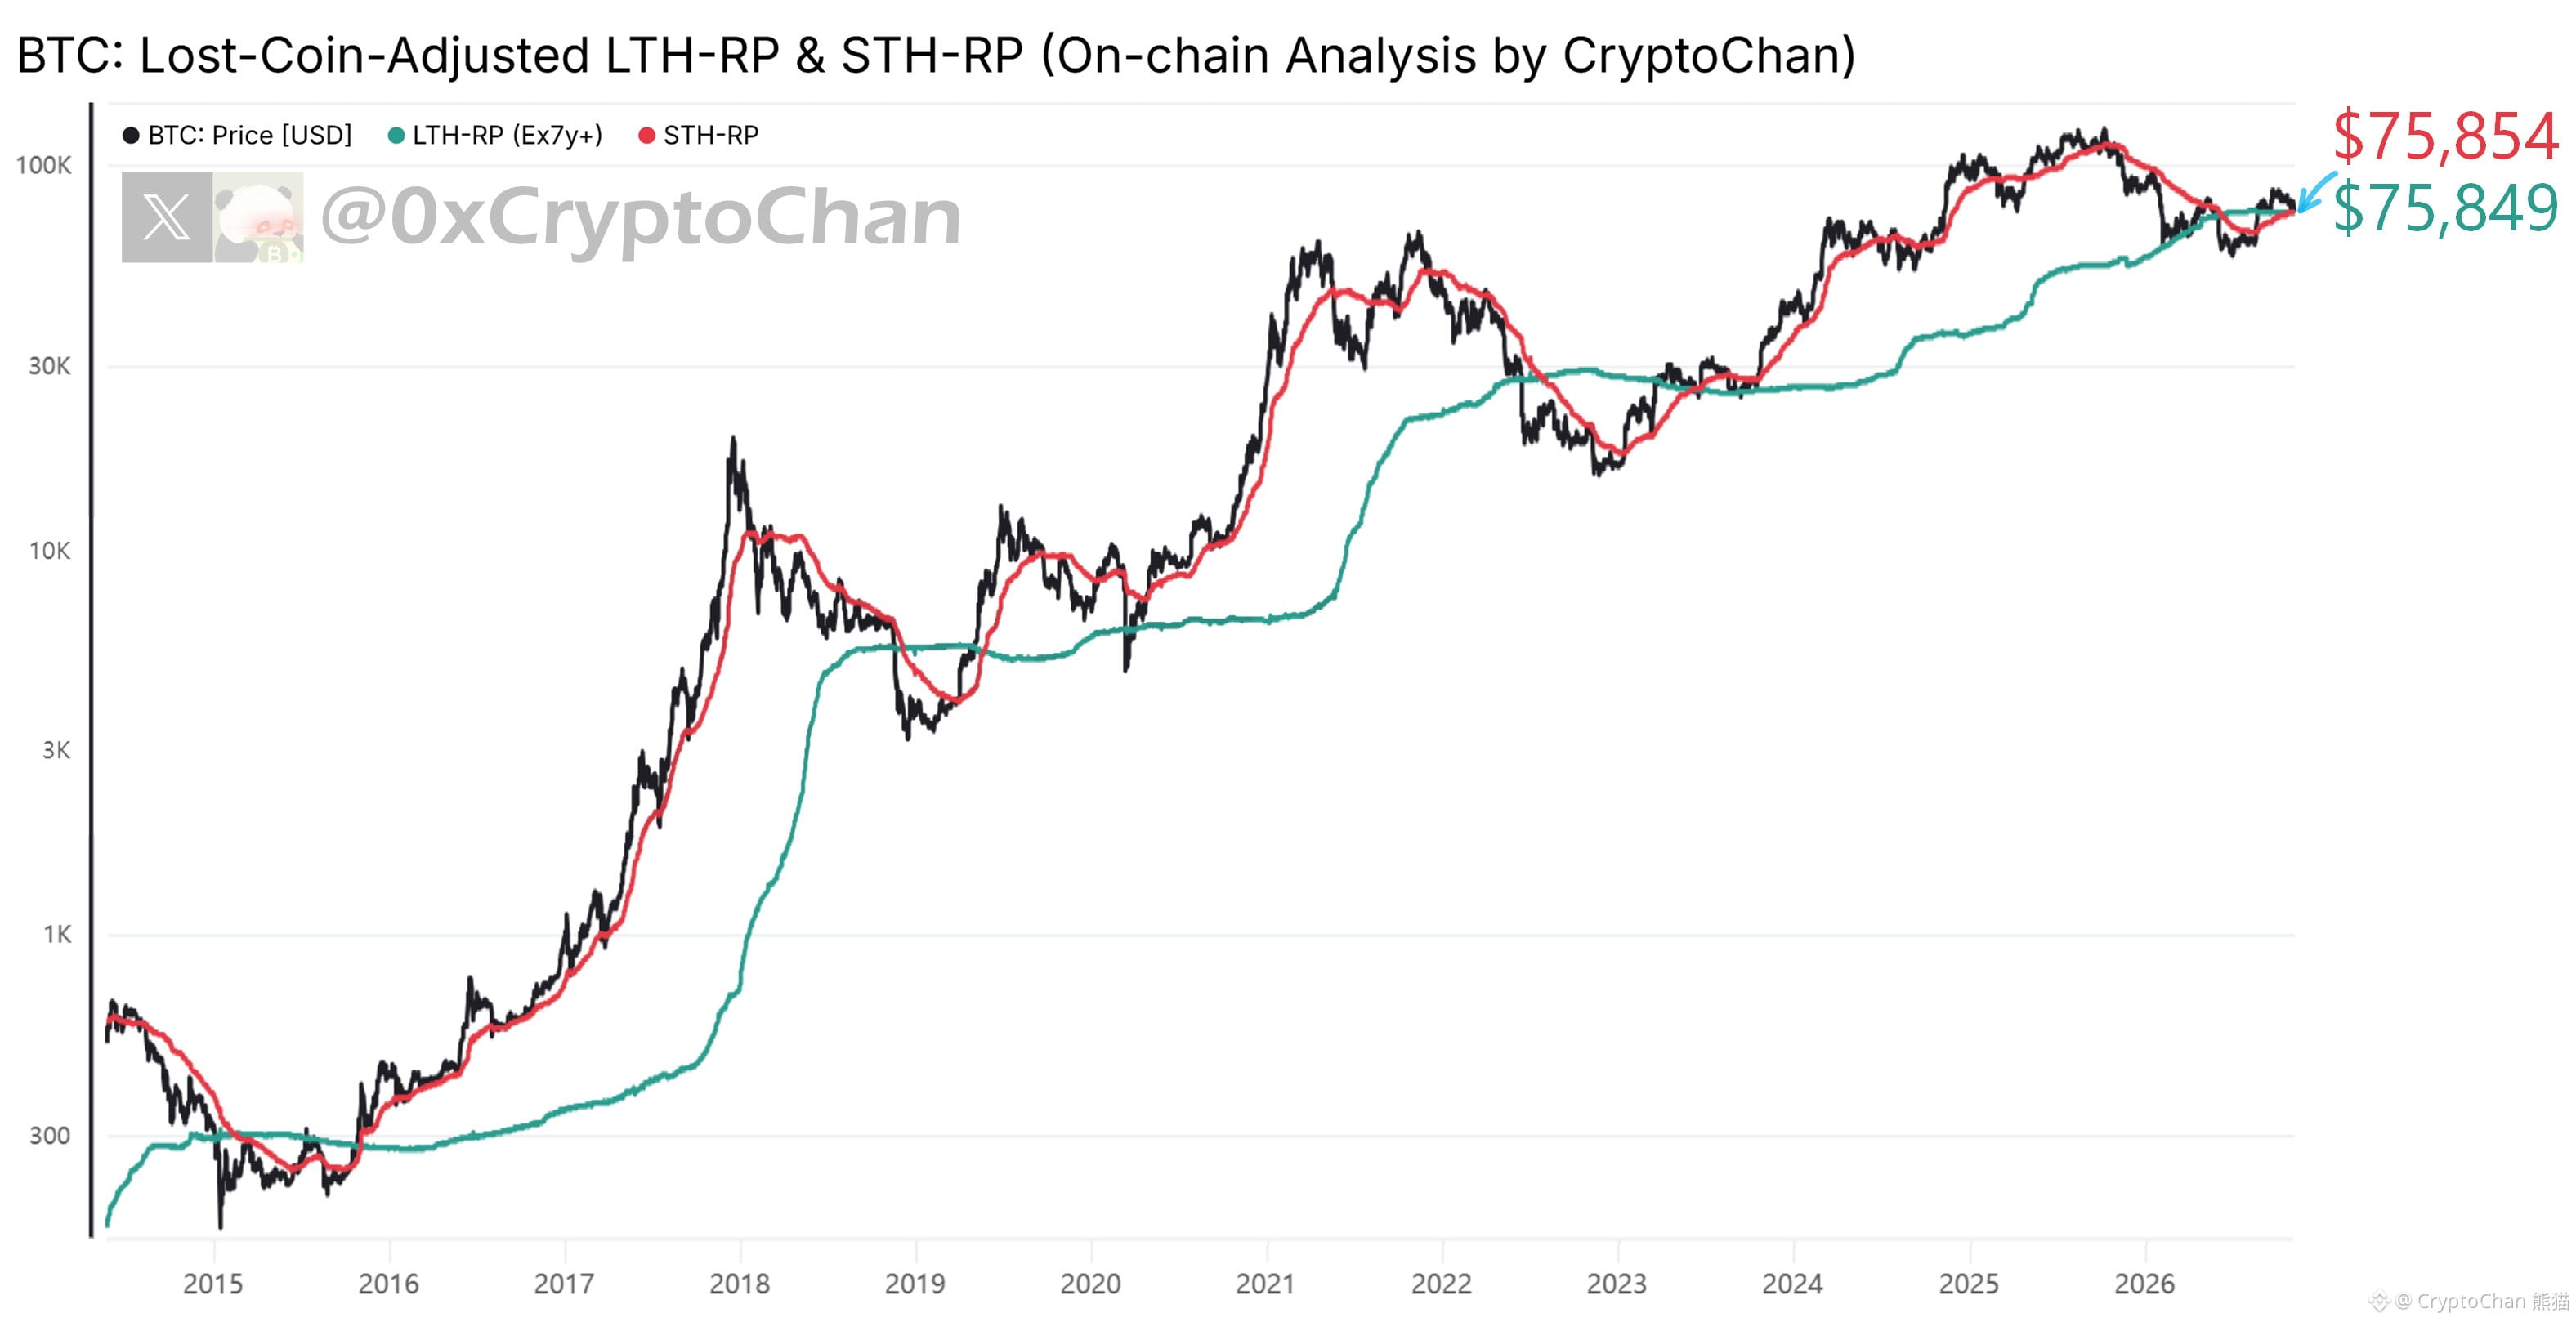
November 2015: The red line breaks through the green line — 1.4 months later to the bull market recovery top
May 2019: The red line breaks through the green line — 1.2 months later to the bull market recovery top
June 2023: The red line breaks through the green line — 1.3 months later to the bull market recovery top
┌─ 🐼 Indicator Details ─┐
Red line: Average buy-in price of on-chain short-term holders’ coin lots
Green line: Average buy-in price of on-chain long-term holders’ coin lots (excluding BTC that hasn’t moved in >7 years)
November 2015: The red line breaks through the green line — 1.4 months later to the bull market recovery top
May 2019: The red line breaks through the green line — 1.2 months later to the bull market recovery top
June 2023: The red line breaks through the green line — 1.3 months later to the bull market recovery top
┌─ 🐼 Indicator Details ─┐
Red line: Average buy-in price of on-chain short-term holders’ coin lots
Green line: Average buy-in price of on-chain long-term holders’ coin lots (excluding BTC that hasn’t moved in >7 years)