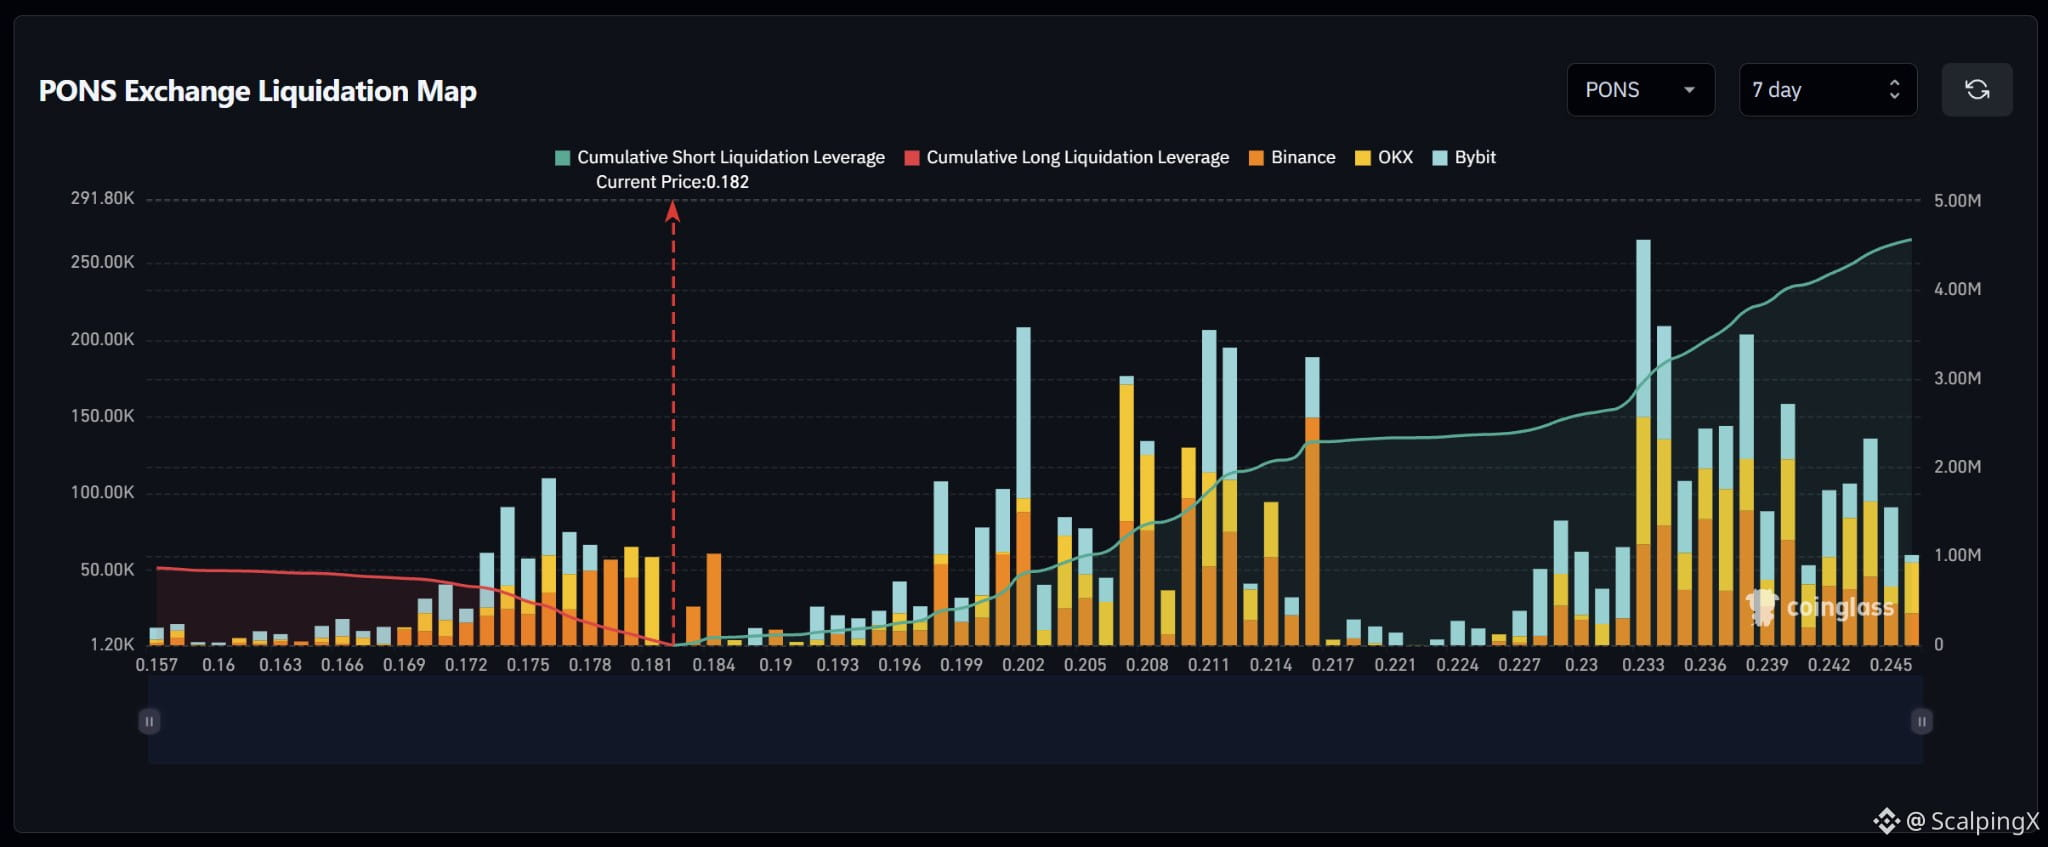
$PONS – Liquidation Map (7 days) – Index ~0.182
🧭 The preferred scenario is a nearby long-liquidation sweep at 0.179–0.181. Estimated cumulative short exposure is substantially larger, but most strong clusters sit further away at 0.198–0.216 and 0.233–0.245.
🔻 Losing 0.181 without reclaiming it shifts attention to 0.179, then 0.174–0.178. The bar near 0.176 is the largest long-side spike; consecutive liquidations across this range could amplify volatility.
🎯 A further break below 0.174 brings 0.170–0.173 into focus. Below 0.169, additional liquidation exposure is limited. A sweep of 0.179–0.181 followed by a quick reclaim of 0.182 would weaken the downside scenario.
⚖️ Clearing and holding above the nearest short cluster at 0.184–0.185 shifts attention to 0.198–0.205, then 0.207–0.216. Bars around 0.189–0.196 are smaller, while 0.217–0.227 is sparse. The next major cluster lies at 0.233–0.245, with a prominent spike near 0.233.
#LiquidationMap
🧭 The preferred scenario is a nearby long-liquidation sweep at 0.179–0.181. Estimated cumulative short exposure is substantially larger, but most strong clusters sit further away at 0.198–0.216 and 0.233–0.245.
🔻 Losing 0.181 without reclaiming it shifts attention to 0.179, then 0.174–0.178. The bar near 0.176 is the largest long-side spike; consecutive liquidations across this range could amplify volatility.
🎯 A further break below 0.174 brings 0.170–0.173 into focus. Below 0.169, additional liquidation exposure is limited. A sweep of 0.179–0.181 followed by a quick reclaim of 0.182 would weaken the downside scenario.
⚖️ Clearing and holding above the nearest short cluster at 0.184–0.185 shifts attention to 0.198–0.205, then 0.207–0.216. Bars around 0.189–0.196 are smaller, while 0.217–0.227 is sparse. The next major cluster lies at 0.233–0.245, with a prominent spike near 0.233.
#LiquidationMap