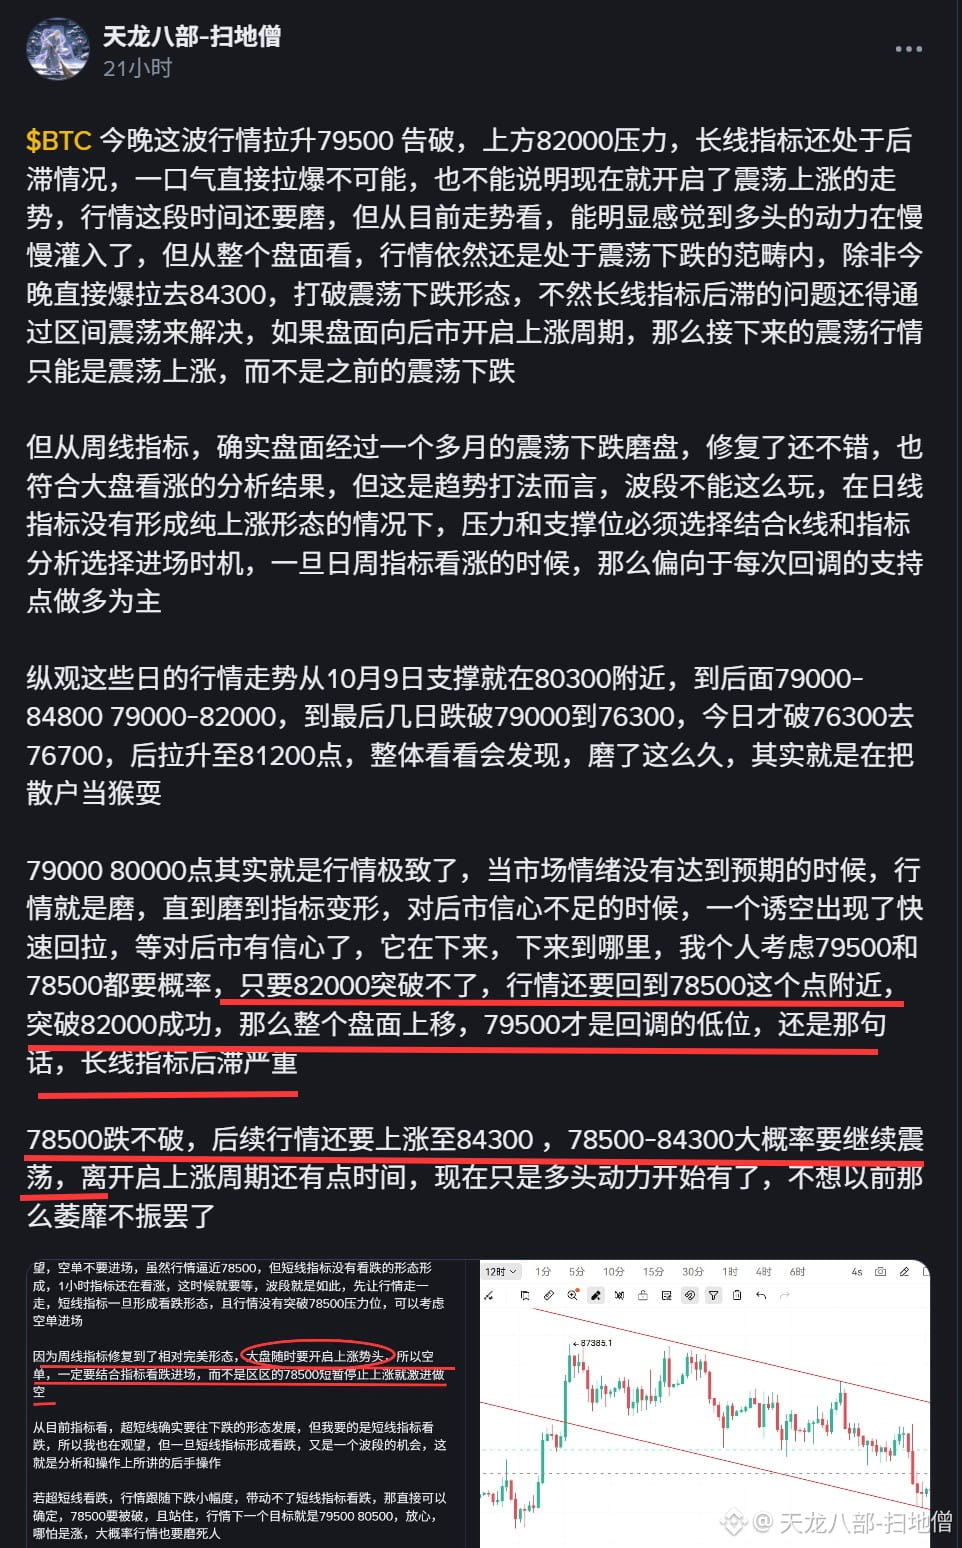
$BTC The price reached 81,200 but failed to break through 82,000, just as previously anticipated. After the decline, 79,500 couldn’t hold, and the price was headed for 78,500. Now that the price is near 78,500, don’t rush into a long position. Check the indicators: as long as the short-term and hourly indicators don’t show a bullish pattern, don’t enter aggressively—the price is likely to fall further.
Why did the price rise from 78,500 to 81,200 but fail to break through 82,000? Mainly because the long-term indicators lag significantly, as I mentioned in an earlier post. But after the price climbed to 81,200, the short-term and hourly indicators hadn’t formed a bearish pattern. We had to consider whether the market makers might push the price up strongly once more before it fell. After an extended period of choppy trading at high levels, the indicators gradually shifted from range-bound to bearish, and the price naturally came down.
The lag in long-term indicators leads to the price repeatedly sweeping up and down—in other words, choppy, grinding price action. So I recommend swing trading, with a preference for waiting for confirmation before entering.
What does waiting for confirmation mean? If the market looked bullish yesterday and you missed the best entry, watch the key resistance at 78,500. If the price reaches that level and the short-term and hourly indicators together don’t show bearish signals, stand aside and keep waiting. Only enter when the indicators turn bearish.
The same goes for today’s drop to 78,500: whether the price is at 79,500 or any other level, don’t enter. Once it gets near 78,500, check the indicators. If they haven’t formed a bullish pattern, stand aside and keep waiting.
For all support and resistance levels, use the candlestick chart and indicators together to choose swing-trading entry points. Don’t scale in as before, and don’t analyze or anticipate moves in advance. Given the current market environment, this is the safest way to trade.
Why did the price rise from 78,500 to 81,200 but fail to break through 82,000? Mainly because the long-term indicators lag significantly, as I mentioned in an earlier post. But after the price climbed to 81,200, the short-term and hourly indicators hadn’t formed a bearish pattern. We had to consider whether the market makers might push the price up strongly once more before it fell. After an extended period of choppy trading at high levels, the indicators gradually shifted from range-bound to bearish, and the price naturally came down.
The lag in long-term indicators leads to the price repeatedly sweeping up and down—in other words, choppy, grinding price action. So I recommend swing trading, with a preference for waiting for confirmation before entering.
What does waiting for confirmation mean? If the market looked bullish yesterday and you missed the best entry, watch the key resistance at 78,500. If the price reaches that level and the short-term and hourly indicators together don’t show bearish signals, stand aside and keep waiting. Only enter when the indicators turn bearish.
The same goes for today’s drop to 78,500: whether the price is at 79,500 or any other level, don’t enter. Once it gets near 78,500, check the indicators. If they haven’t formed a bullish pattern, stand aside and keep waiting.
For all support and resistance levels, use the candlestick chart and indicators together to choose swing-trading entry points. Don’t scale in as before, and don’t analyze or anticipate moves in advance. Given the current market environment, this is the safest way to trade.