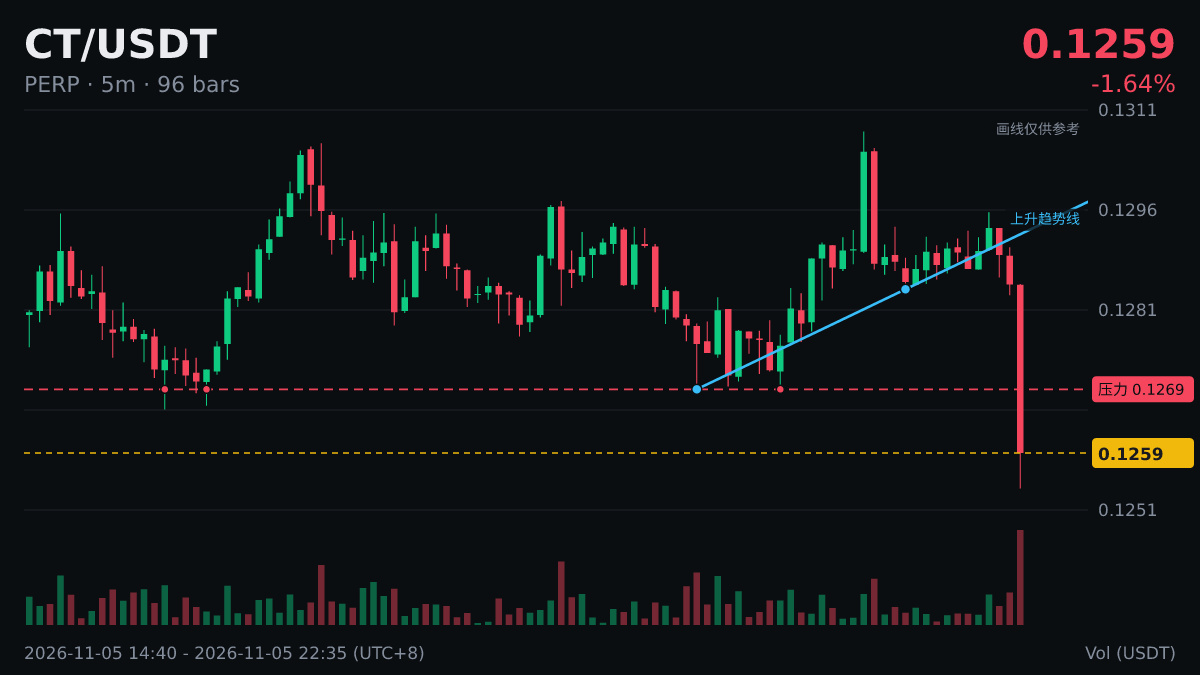
The K-line chart is doing an ECG again—and this time it’s the low-blood-sugar kind.
($CT 5 minutes -2.12%, current price 0.1257)
What signals do you usually wait for before making a move?
($CT 5 minutes -2.12%, current price 0.1257)
What signals do you usually wait for before making a move?