🚀 Live Technical Analysis: $IOST / USDT (Perpetual - 15m) 📈
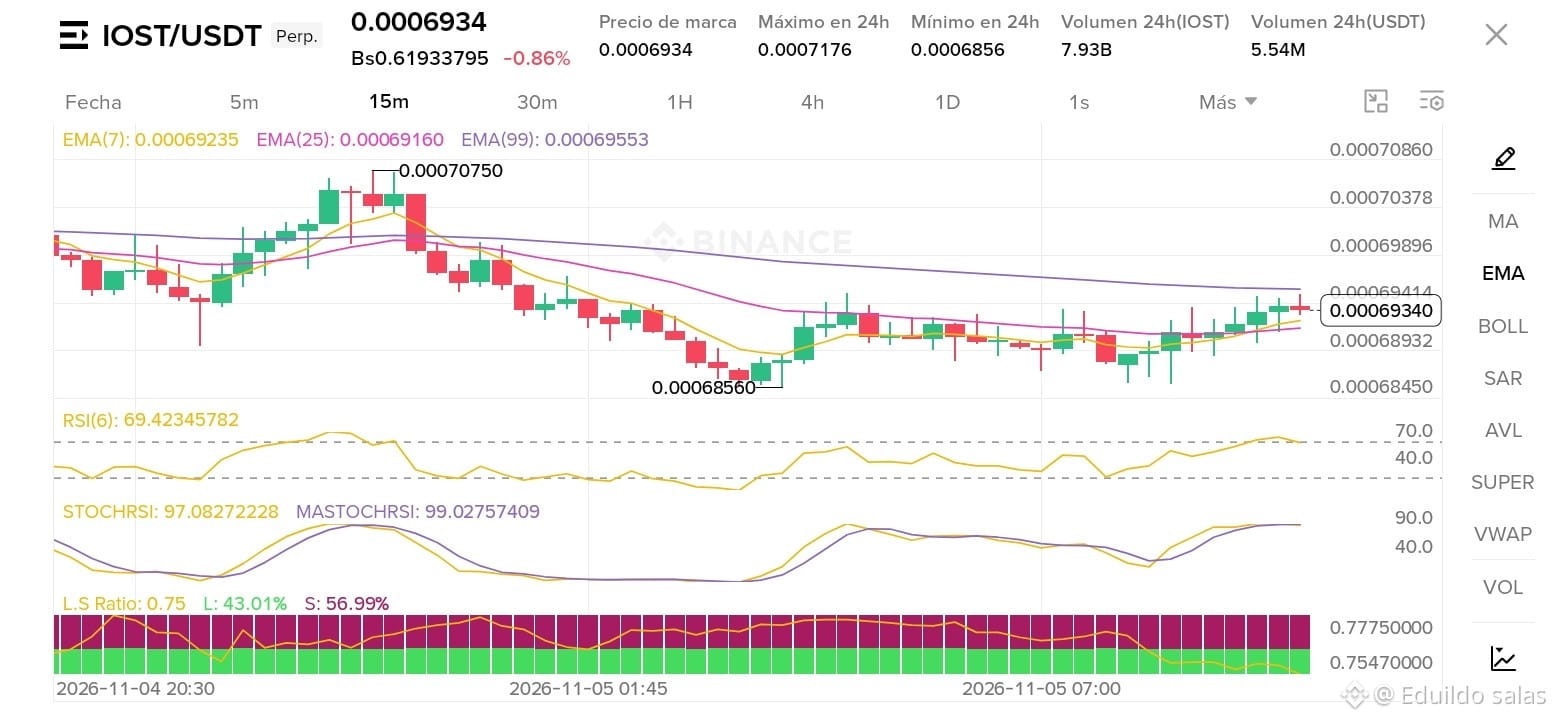
The $IOST pair is showing an interesting battle on the 15-minute chart after bouncing from its 24-hour low of 0.00068560 and moving toward a recent high near 0.00070750. Could this be the start of a new impulse or a key consolidation? 👀👇
📊 What are the indicators telling us?
Current Price: At 0.00069340 (-0.86%), trading right in a short-term equilibrium zone.
Moving Averages (EMA 7, 25, 99): The lines are quite compressed and intertwined around the current price, indicating a clear compression phase as the market awaits a move backed by strong volume.
RSI (6): At 69.42, dangerously close to the overbought zone. Buyers are trying to take control, but immediate resistance could temporarily hold them back.
StochRSI: Elevated readings (97.08 and 99.02) suggest that the asset is near the top of its current range. Keep a close eye out for a possible relief pullback or continued bullish pressure if more volume comes in.
L/S Ratio: Currently at 0.75 (Longs: 43.01% / Shorts: 56.99%), indicating a slight dominance of short positions, which could fuel a potential short squeeze if the price breaks through the upper resistance with force.
💡 Conclusion: Closely monitoring a breakout from the current range. Will it break through 0.00070750 with force, or seek support at the lower EMAs?
How do you see your position shaping up over the next few hours? Let me know in the comments! 👇💬
#IOST #CryptoTrading #BinanceSquare #BinancePick
The $IOST pair is showing an interesting battle on the 15-minute chart after bouncing from its 24-hour low of 0.00068560 and moving toward a recent high near 0.00070750. Could this be the start of a new impulse or a key consolidation? 👀👇
📊 What are the indicators telling us?
Current Price: At 0.00069340 (-0.86%), trading right in a short-term equilibrium zone.
Moving Averages (EMA 7, 25, 99): The lines are quite compressed and intertwined around the current price, indicating a clear compression phase as the market awaits a move backed by strong volume.
RSI (6): At 69.42, dangerously close to the overbought zone. Buyers are trying to take control, but immediate resistance could temporarily hold them back.
StochRSI: Elevated readings (97.08 and 99.02) suggest that the asset is near the top of its current range. Keep a close eye out for a possible relief pullback or continued bullish pressure if more volume comes in.
L/S Ratio: Currently at 0.75 (Longs: 43.01% / Shorts: 56.99%), indicating a slight dominance of short positions, which could fuel a potential short squeeze if the price breaks through the upper resistance with force.
💡 Conclusion: Closely monitoring a breakout from the current range. Will it break through 0.00070750 with force, or seek support at the lower EMAs?
How do you see your position shaping up over the next few hours? Let me know in the comments! 👇💬
#IOST #CryptoTrading #BinanceSquare #BinancePick