
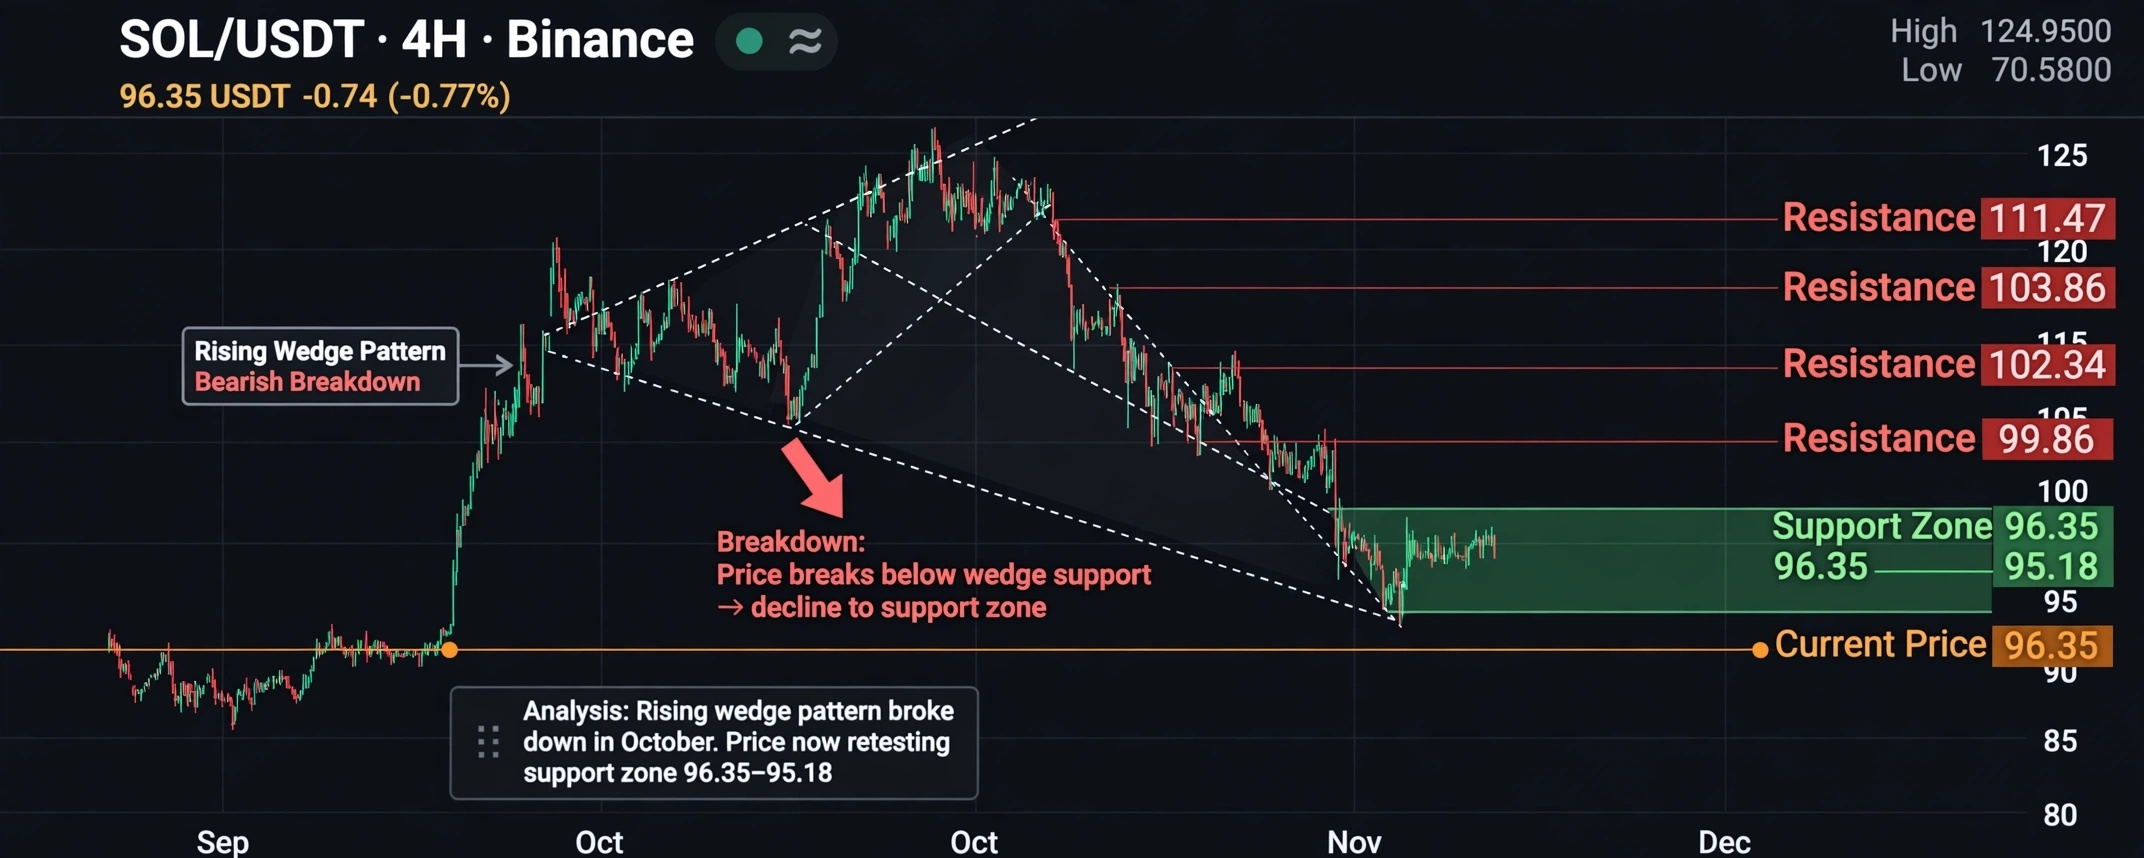

Here is what your screenshot shows:
Chart Structure:
• The rising wedge pattern at the top-center of the chart, right around the October peak, marked with the diagonal trendlines - that's where SOL topped out near $124.95 High. Classic bearish wedge that broke down. • Resistance cluster at the top-right horizontal levels - $111.47 / $103.86 / $102.33 / $99.85. These are now all overhead supply after the breakdown. • Key support line in the middle-lower part of the chart - the green box you have marked around $96.35 - $95.17. Price is sitting right ON it. This is the make-or-break zone. • Current price display on the right-side price scale and top-left ticker - showing $96.35 and Low $95.17, which matches spot data today: SOL is at $94-$96 on Binance spot.
Why Bears Are In Control (as of Nov 5):
1. EMA Stack Bearish: SOL is trading below all major EMAs. The 50-day EMA at $102.78, 100-day at $99.61 and 200-day at $98.39 are all stacked above price as resistance. Your 4H chart also shows price stuck under the $99 - $103.8 zone. 2. Technical Summary = Sell: Current oscillators show 3 Buy, 4 Neutral, 4 Sell and Moving Averages show 6 Sell. Overall bias is Sell. 3. Wedge Breakdown Target: The wedge breakdown in early October started the correction from ∼$125 rejection. Analysts are watching $90-$93 as immediate support for the first corrective wave, with a deeper demand zone at $73-$78 if that fails.
My Prediction / Game Plan for Binance Square:
This is NOT financial advice. 2 scenarios:
Bearish Continuation (Higher Probability):
If 4H closes below $95.17 - $95.26 support, we likely see a quick flush toward $93.54 - $90.00. That's the near-term support cluster and the expected November range low.
Invalidation for bears would be reclaiming $99.85.
Bullish Reclaim (Need Confirmation):
Bulls need to reclaim $99.85 - $102.33 and then $103.86 to turn momentum. Only a 4H close above $103.86 would open $111.47. Multi-timeframe data shows some 15m long attempts but daily trend is still weak.
Key Levels to Watch:
Support: $95.17 (your low) > $93.54 > $90.00
Resistance: $99.85 > $102.33 > $103.86 > $111.47
Target Range for Nov 2026: $90 - $103.17 with average $98
SOL is at a decision point. The $96.35 level you are holding is the last defense before the $90 retest. Don't long blindly - wait for reclaim or breakdown confirmation on volume.
What do you think? Will $95 hold?
#solana #SOLUSDT #CryptoAnalysis #BinanceSquare

