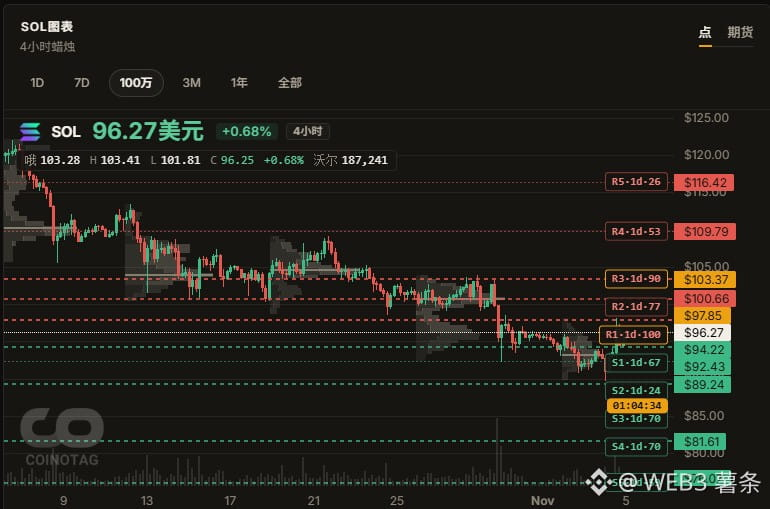
On November 4, #solana fell below the $100 mark, retreating from a high of around $124 in October to a low of $92.69. The drop pushed SOL below its major daily moving averages, indicating that the short-term trend remains weak.
More notably, SOL fell below the key support level of $98, and trading volume increased during the decline, pointing to considerable selling pressure rather than a routine, temporary pullback.
Key support and resistance:
Resistance: $97.85 is a key resistance level. SOL would need to break above it before it could challenge $100 again.
Support: $89.24 is a key support level. If the price falls below $90, it could drop further to $85 or even $80.
As for technical indicators, the RSI is at 38.09, and the MACD is also signaling bearish momentum, suggesting that buying pressure remains weak.
SOL has rebounded to around $96, but the downtrend has not truly reversed. In the short term, watch whether it can reclaim $97.85 and recover $100. Otherwise, the risk of further declines remains, so avoid blindly buying the dip.
More notably, SOL fell below the key support level of $98, and trading volume increased during the decline, pointing to considerable selling pressure rather than a routine, temporary pullback.
Key support and resistance:
Resistance: $97.85 is a key resistance level. SOL would need to break above it before it could challenge $100 again.
Support: $89.24 is a key support level. If the price falls below $90, it could drop further to $85 or even $80.
As for technical indicators, the RSI is at 38.09, and the MACD is also signaling bearish momentum, suggesting that buying pressure remains weak.
SOL has rebounded to around $96, but the downtrend has not truly reversed. In the short term, watch whether it can reclaim $97.85 and recover $100. Otherwise, the risk of further declines remains, so avoid blindly buying the dip.