


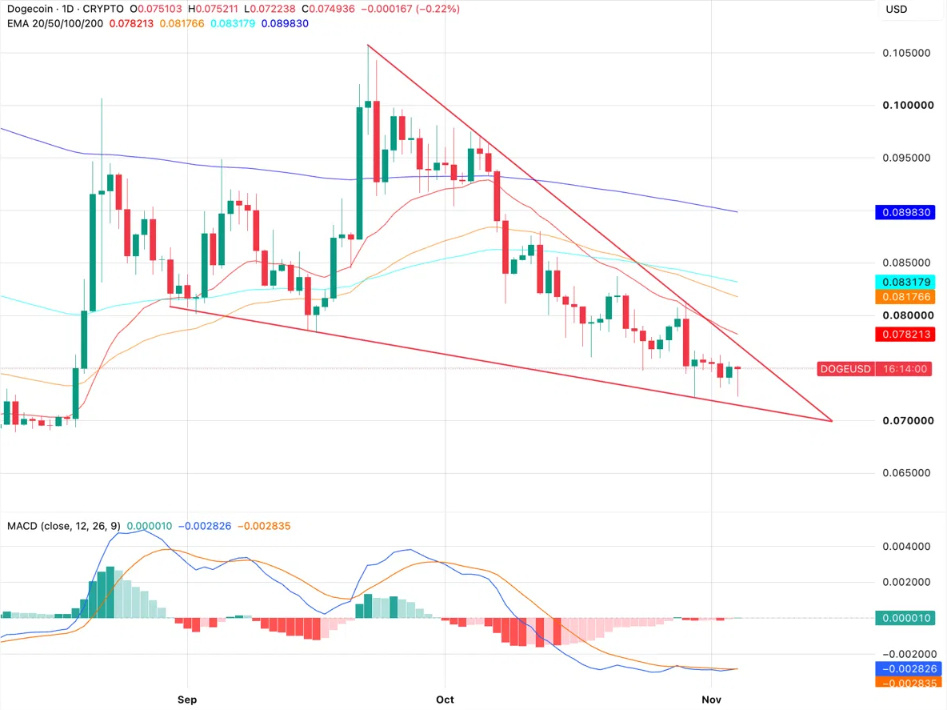
Dogecoin fell 20% in October, matching its decline in 2025 and ranking as the third-largest October drop in its 13-year record. The price is now around 0.0749. To turn things around in November, the first hurdle is 0.0782—the 20-day moving average and the upper edge of the narrowing wedge.
Where does DOGE stand now?
Dogecoin rebounded from 0.0722 to 0.0749, though it still slipped 0.22% on the day. This low is just 0.0007 above the 0.0715 support level. Selling pressure has eased somewhat, but upward momentum remains weak.
Resistance levels above: 0.0772 is the upper boundary of the narrowing range; 0.0782 is the 20-day moving average plus the upper edge of the wedge, and the most important level. 0.0818 is the 50-day moving average, 0.0832 is the 100-day moving average, and 0.0898 is the 200-day moving average.
A daily close above 0.0782 would confirm a breakout above the 20-day moving average and the wedge's upper trendline. Around November 15, the trading range is expected to narrow further. For now, DOGE is more likely to trade between 0.0715 and 0.0782. If it breaks below 0.0715 on the daily chart, the next target is the summer low at 0.0680.
Weekly chart: the trend is still down
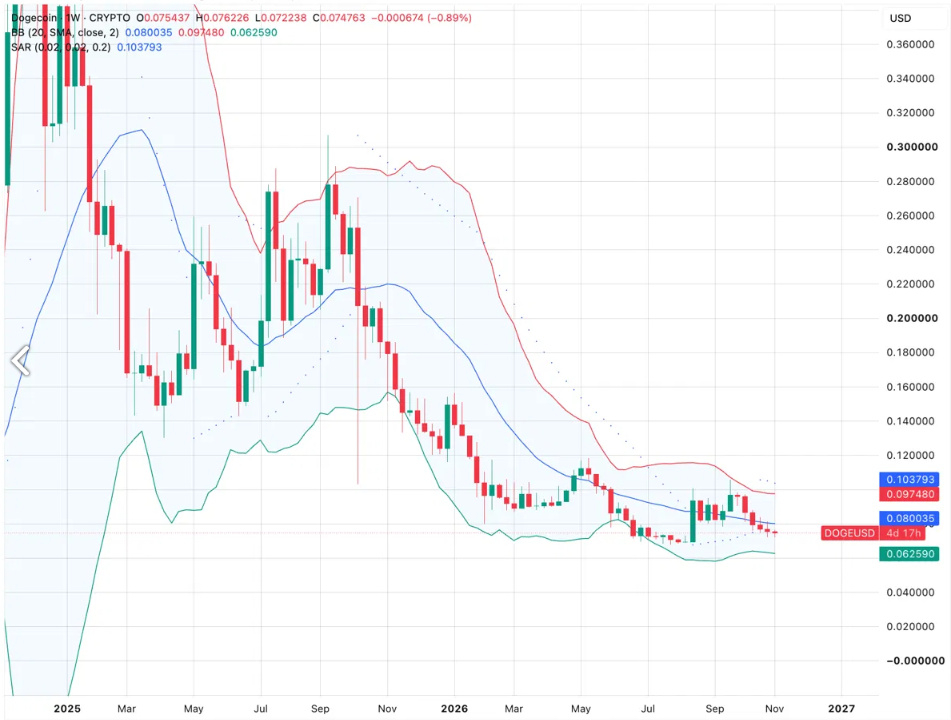
On the weekly chart, Dogecoin is around 0.0748, below the Bollinger Band middle line at 0.0800 and above the lower band at 0.0626. The Parabolic SAR is at 0.1038 and the upper band is at 0.0975, both well above the current price. The weekly trend is still down.
Dogecoin is down about 75% from its September 2025 high near 0.30 and has been trading between 0.068 and 0.105 since the summer. The downtrend would ease only if the weekly close moves above the 0.0800 middle line; if 0.0680 fails to hold, the lower weekly band at 0.0626 is the next floor.
What does Polymarket say? Range-bound, with no clear direction
Polymarket data puts the odds of Dogecoin reaching 0.10 in November at 14%, and the odds of it falling to 0.05 at 16%. In other words, traders see roughly a one-in-seven chance of a move back near the September high, and about a one-in-six chance of a drop to 0.05—overall, a range-bound outlook with neither direction clearly favored.
However, trading is very thin, with less than $500 in volume on each contract and just $5 on one of them. For the $0.05 market, the prices of “Yes” and “No” add up to more than $1, indicating a wide spread. So treat this data as a sentiment gauge, not a forecast.
What’s happening with Bitcoin?
Analyst Michaël van de Poppe believes Bitcoin has rebounded strongly from its lows and may now be at the bottom of this correction. It has not fallen to $75,000, as many traders expected. He sees the midterm election results and potential liquidity measures from Scott Bessent as the next catalysts. If Bitcoin can break decisively above $79,000, he’ll be more confident that the correction is over.
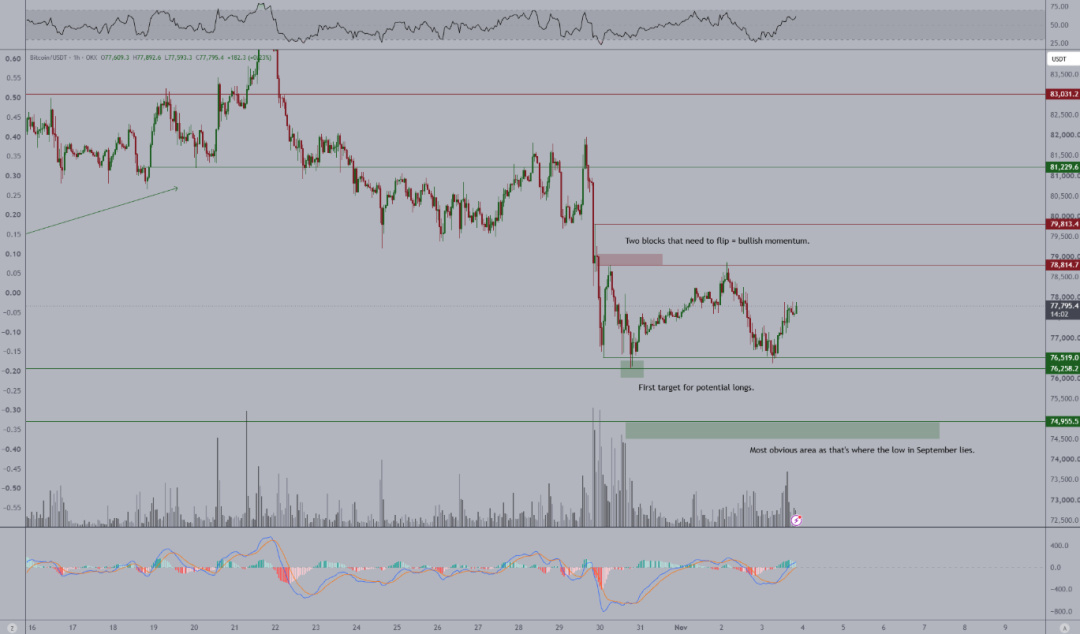
This matters a lot for Dogecoin, because it usually follows Bitcoin. A Bitcoin rebound from the bottom could provide the market conditions Dogecoin currently lacks. But Dogecoin still has to do its part—a close above 0.0782 is needed for a rebound to show up on the chart.
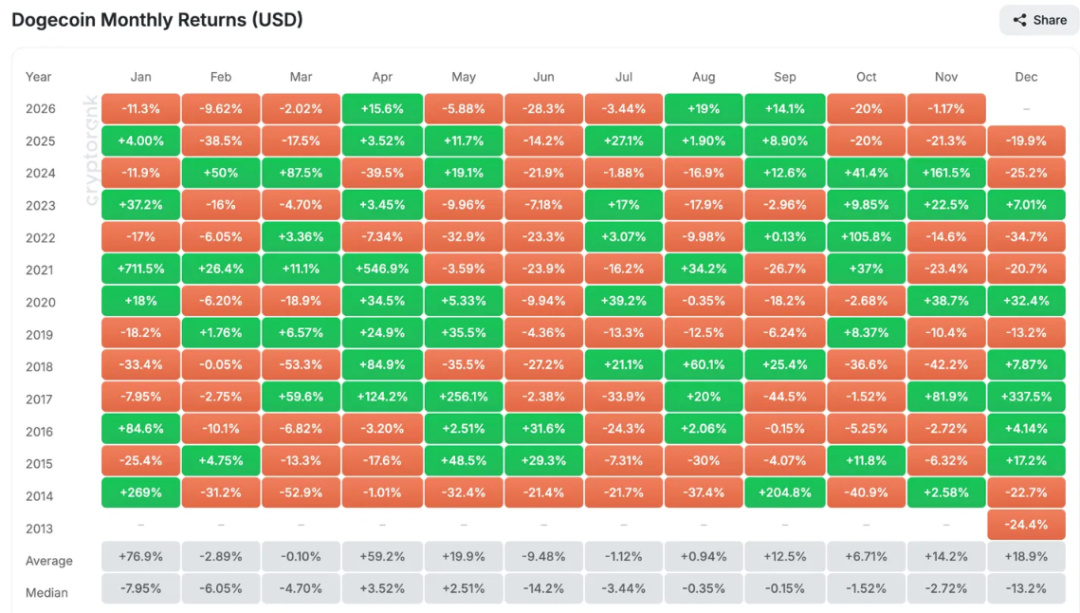
November’s historical pattern: an average gain of 14.2%, but seven Novembers have been down
Over the past 12 Novembers, Dogecoin has gained an average of 14.2%, but it has fallen in seven of them. In the six Novembers following an October drop of 20%, three were up and three were down. Midterm election years have tended to be weak: Dogecoin fell 42.2% in November 2018 and 14.6% in November 2022, while it rose 2.58% in 2014.
The median November return is -2.72%. Dogecoin is already down 1.17%, so another drop of about 1.6% would take it to 0.0738. The average return of +14.2% would put it near 0.0866, requiring a gain of about 15.6% from the current price.
Two scenarios
1. Bullish, target 0.0832: Hold above the wedge's lower boundary at 0.0715, then close above 0.0782 (the 20-day moving average and the wedge's upper trendline), followed by a break above the weekly middle line at 0.0800 and the 50-day moving average at 0.0818. The next stop would be the 100-day moving average at 0.0832, about 11% above the current price. Beyond that is the 200-day moving average at 0.0898. A Bitcoin close above $79,000 would also fit this scenario. The target is well below 0.10, consistent with Polymarket’s 14% odds.
2. Bearish, risk level 0.0680: A close below the wedge's lower boundary at 0.0715 would put the summer low at 0.0680 in focus. A further break lower would bring the weekly lower band at 0.0626 into view. Bitcoin meeting resistance at $79,000 and falling back toward $75,000 would also fit this scenario.