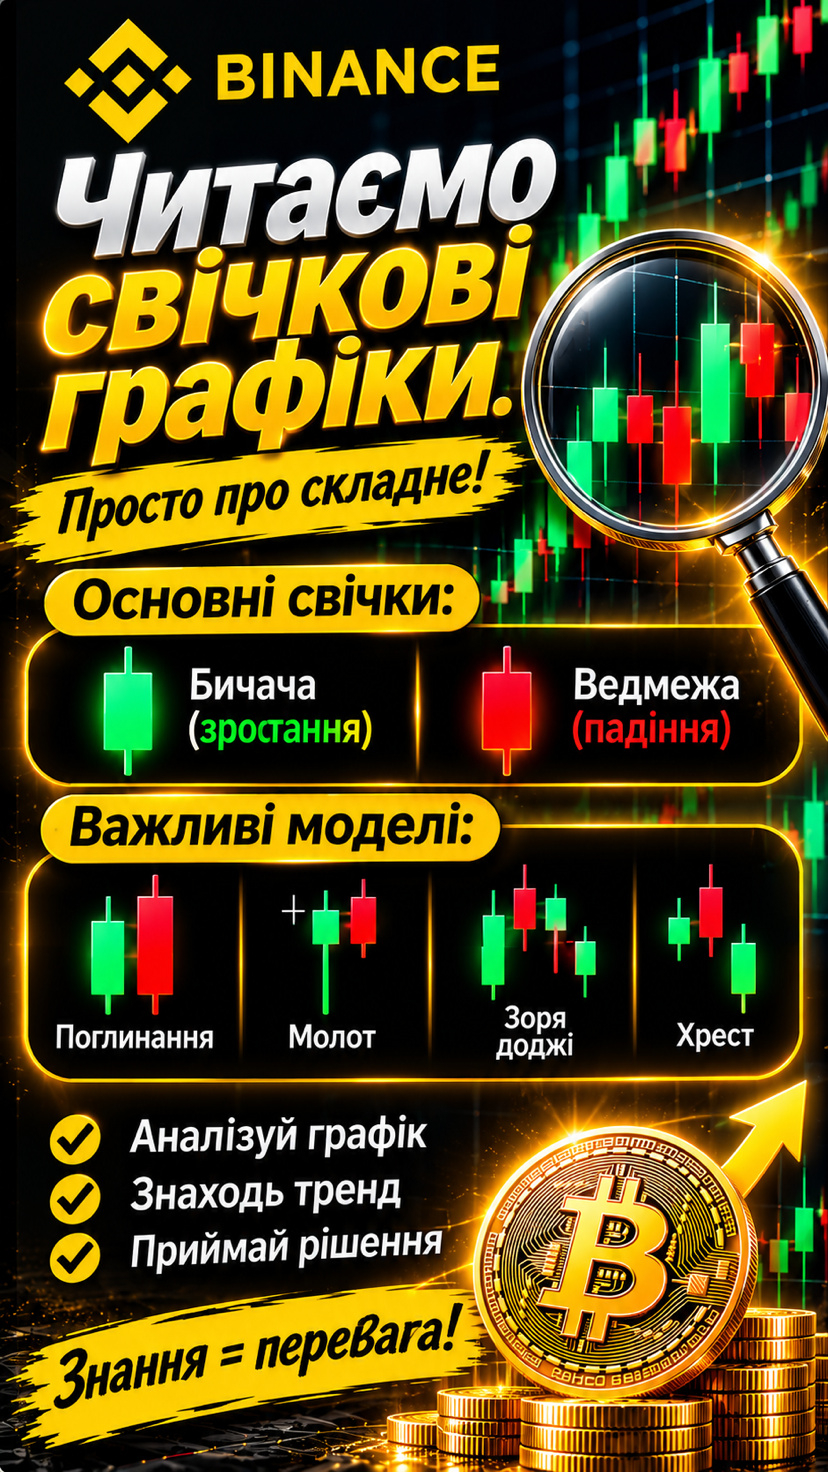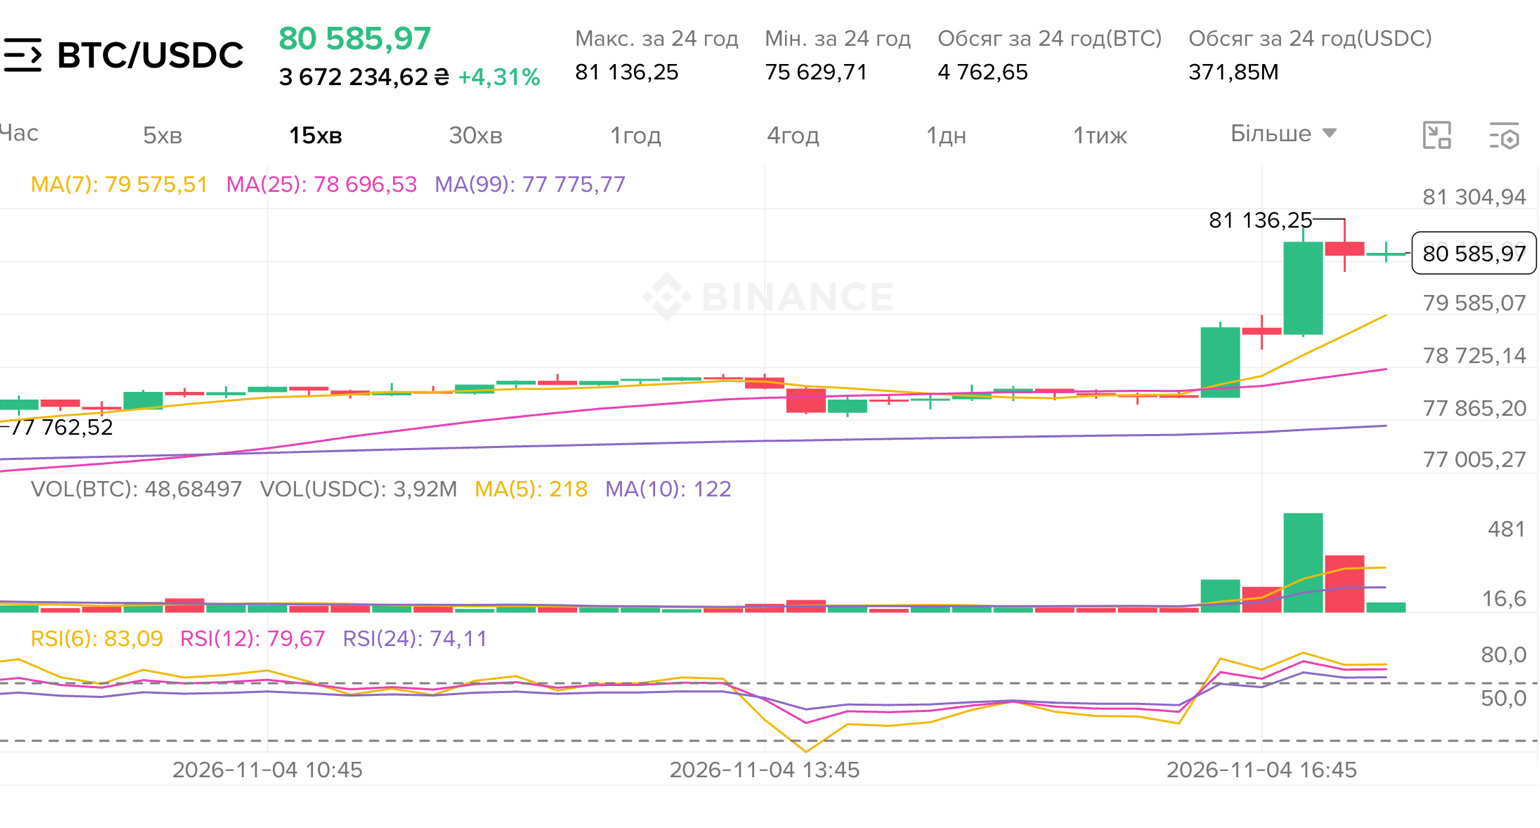
📊 HOW TO READ CANDLESTICK CHARTS? A SIMPLE EXPLANATION!
If you want to better understand the cryptocurrency market, start with a candlestick chart.
Candles show how an asset’s price changed over a certain period of time.
🟢 A green candle means the price closed higher than it opened.
🔴 A red candle means the price closed lower than it opened.
Each candle has four important values:
1️⃣ Open — the opening price.
2️⃣ Close — the closing price.
3️⃣ High — the highest price.
4️⃣ Low — the lowest price.
💡 What else should you know?
• A long candle body may indicate a stronger price move.
• Long wicks show that the price moved away from the opening or closing level.
• A sequence of candles helps assess the market trend.
⚠️ Important: a single candle cannot guarantee the price’s next move. Analyze the overall picture.
Can you already read candlestick charts?
#Binance #CryptoEducation #Trading #Bitcoin #Candlestick
If you want to better understand the cryptocurrency market, start with a candlestick chart.
Candles show how an asset’s price changed over a certain period of time.
🟢 A green candle means the price closed higher than it opened.
🔴 A red candle means the price closed lower than it opened.
Each candle has four important values:
1️⃣ Open — the opening price.
2️⃣ Close — the closing price.
3️⃣ High — the highest price.
4️⃣ Low — the lowest price.
💡 What else should you know?
• A long candle body may indicate a stronger price move.
• Long wicks show that the price moved away from the opening or closing level.
• A sequence of candles helps assess the market trend.
⚠️ Important: a single candle cannot guarantee the price’s next move. Analyze the overall picture.
Can you already read candlestick charts?
#Binance #CryptoEducation #Trading #Bitcoin #Candlestick