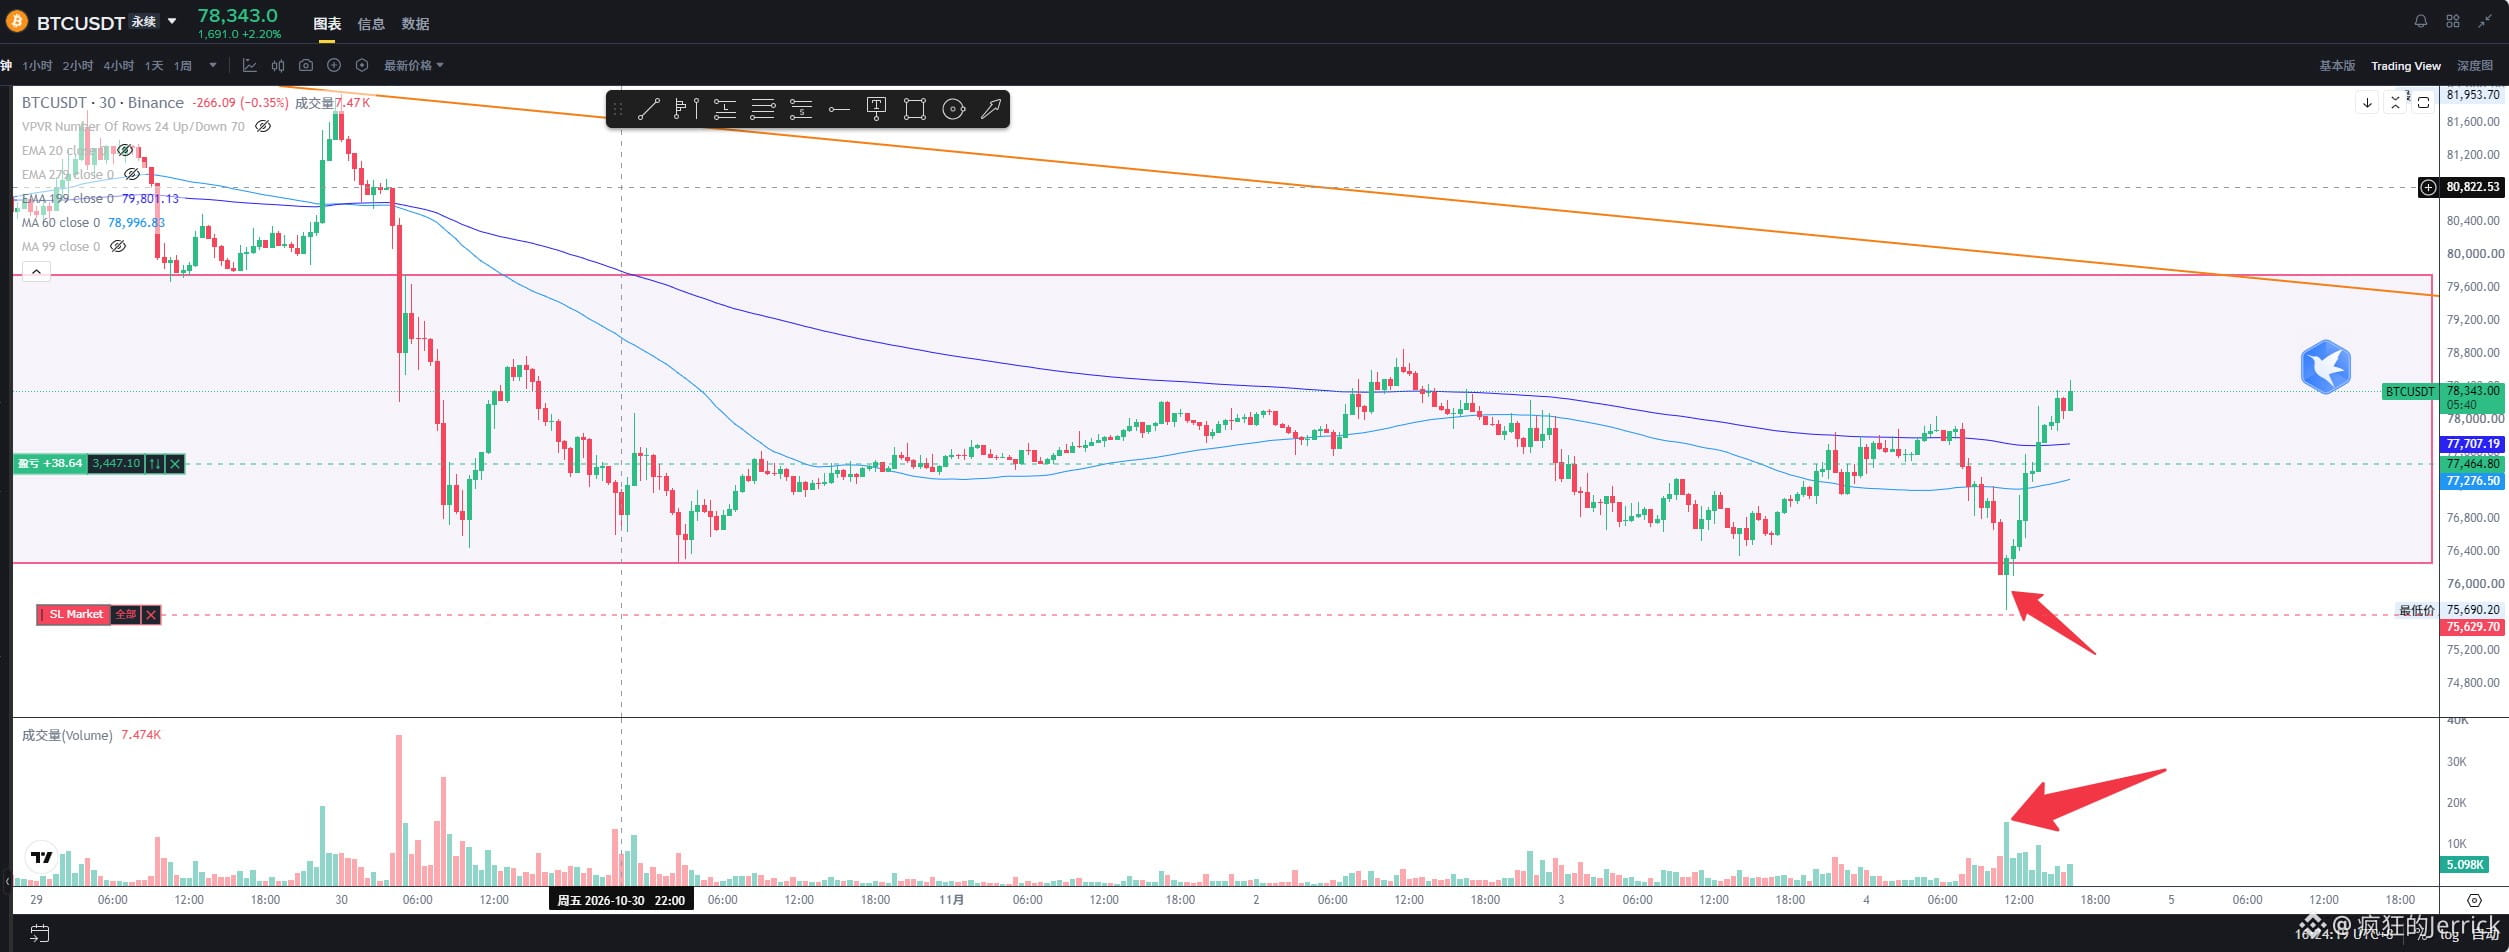
Why you should go long at this level, even if you have to sell everything you own!
Looking back, this was an excellent entry point for a long position.
So why didn’t I go long right away at this level?
The only reason was my limited understanding as a retail trader!
Here are a few reasons why this looked bullish:
1) Major event risk was out of the way! The midterm election results were in. Since the market had been in a steady downtrend ahead of the midterms, once the event was behind us, it didn’t really matter whether Trump or the Democrats won—the market was due for a rebound after all that selling.
2) Volume surged at a key support level! After the price made a new low, it quickly recovered, forming a 30-minute candle with a long lower wick and exceptionally high volume. This is a classic bullish reversal signal.
3) At the same time, huge bullish candles appeared across U.S. stocks, the Nasdaq, the Shanghai Composite, Korean stocks, Hong Kong stocks, gold, and more. Bitcoin had mostly followed the broader market before, so it was highly likely to follow suit here!
4) A key support level on the daily chart! This was also a significant daily support level. The price rebounded and stabilized around this area on September 16 and August 23, 2026.
Although I did eventually go long, and I’m now sitting on some profit, I didn’t confidently enter right after the first 30-minute candle closed. That just shows I still have a long way to go on my trading journey.
Now that I’ve already put my chips on the table, let’s see if I can land the big fish—or the big bull!
#美国中期选举:市场有哪些期待?
$BTC
Looking back, this was an excellent entry point for a long position.
So why didn’t I go long right away at this level?
The only reason was my limited understanding as a retail trader!
Here are a few reasons why this looked bullish:
1) Major event risk was out of the way! The midterm election results were in. Since the market had been in a steady downtrend ahead of the midterms, once the event was behind us, it didn’t really matter whether Trump or the Democrats won—the market was due for a rebound after all that selling.
2) Volume surged at a key support level! After the price made a new low, it quickly recovered, forming a 30-minute candle with a long lower wick and exceptionally high volume. This is a classic bullish reversal signal.
3) At the same time, huge bullish candles appeared across U.S. stocks, the Nasdaq, the Shanghai Composite, Korean stocks, Hong Kong stocks, gold, and more. Bitcoin had mostly followed the broader market before, so it was highly likely to follow suit here!
4) A key support level on the daily chart! This was also a significant daily support level. The price rebounded and stabilized around this area on September 16 and August 23, 2026.
Although I did eventually go long, and I’m now sitting on some profit, I didn’t confidently enter right after the first 30-minute candle closed. That just shows I still have a long way to go on my trading journey.
Now that I’ve already put my chips on the table, let’s see if I can land the big fish—or the big bull!
#美国中期选举:市场有哪些期待?
$BTC