📉 Bitcoin’s Three-Cycle Review: “Bottom After the Election → Rebound”
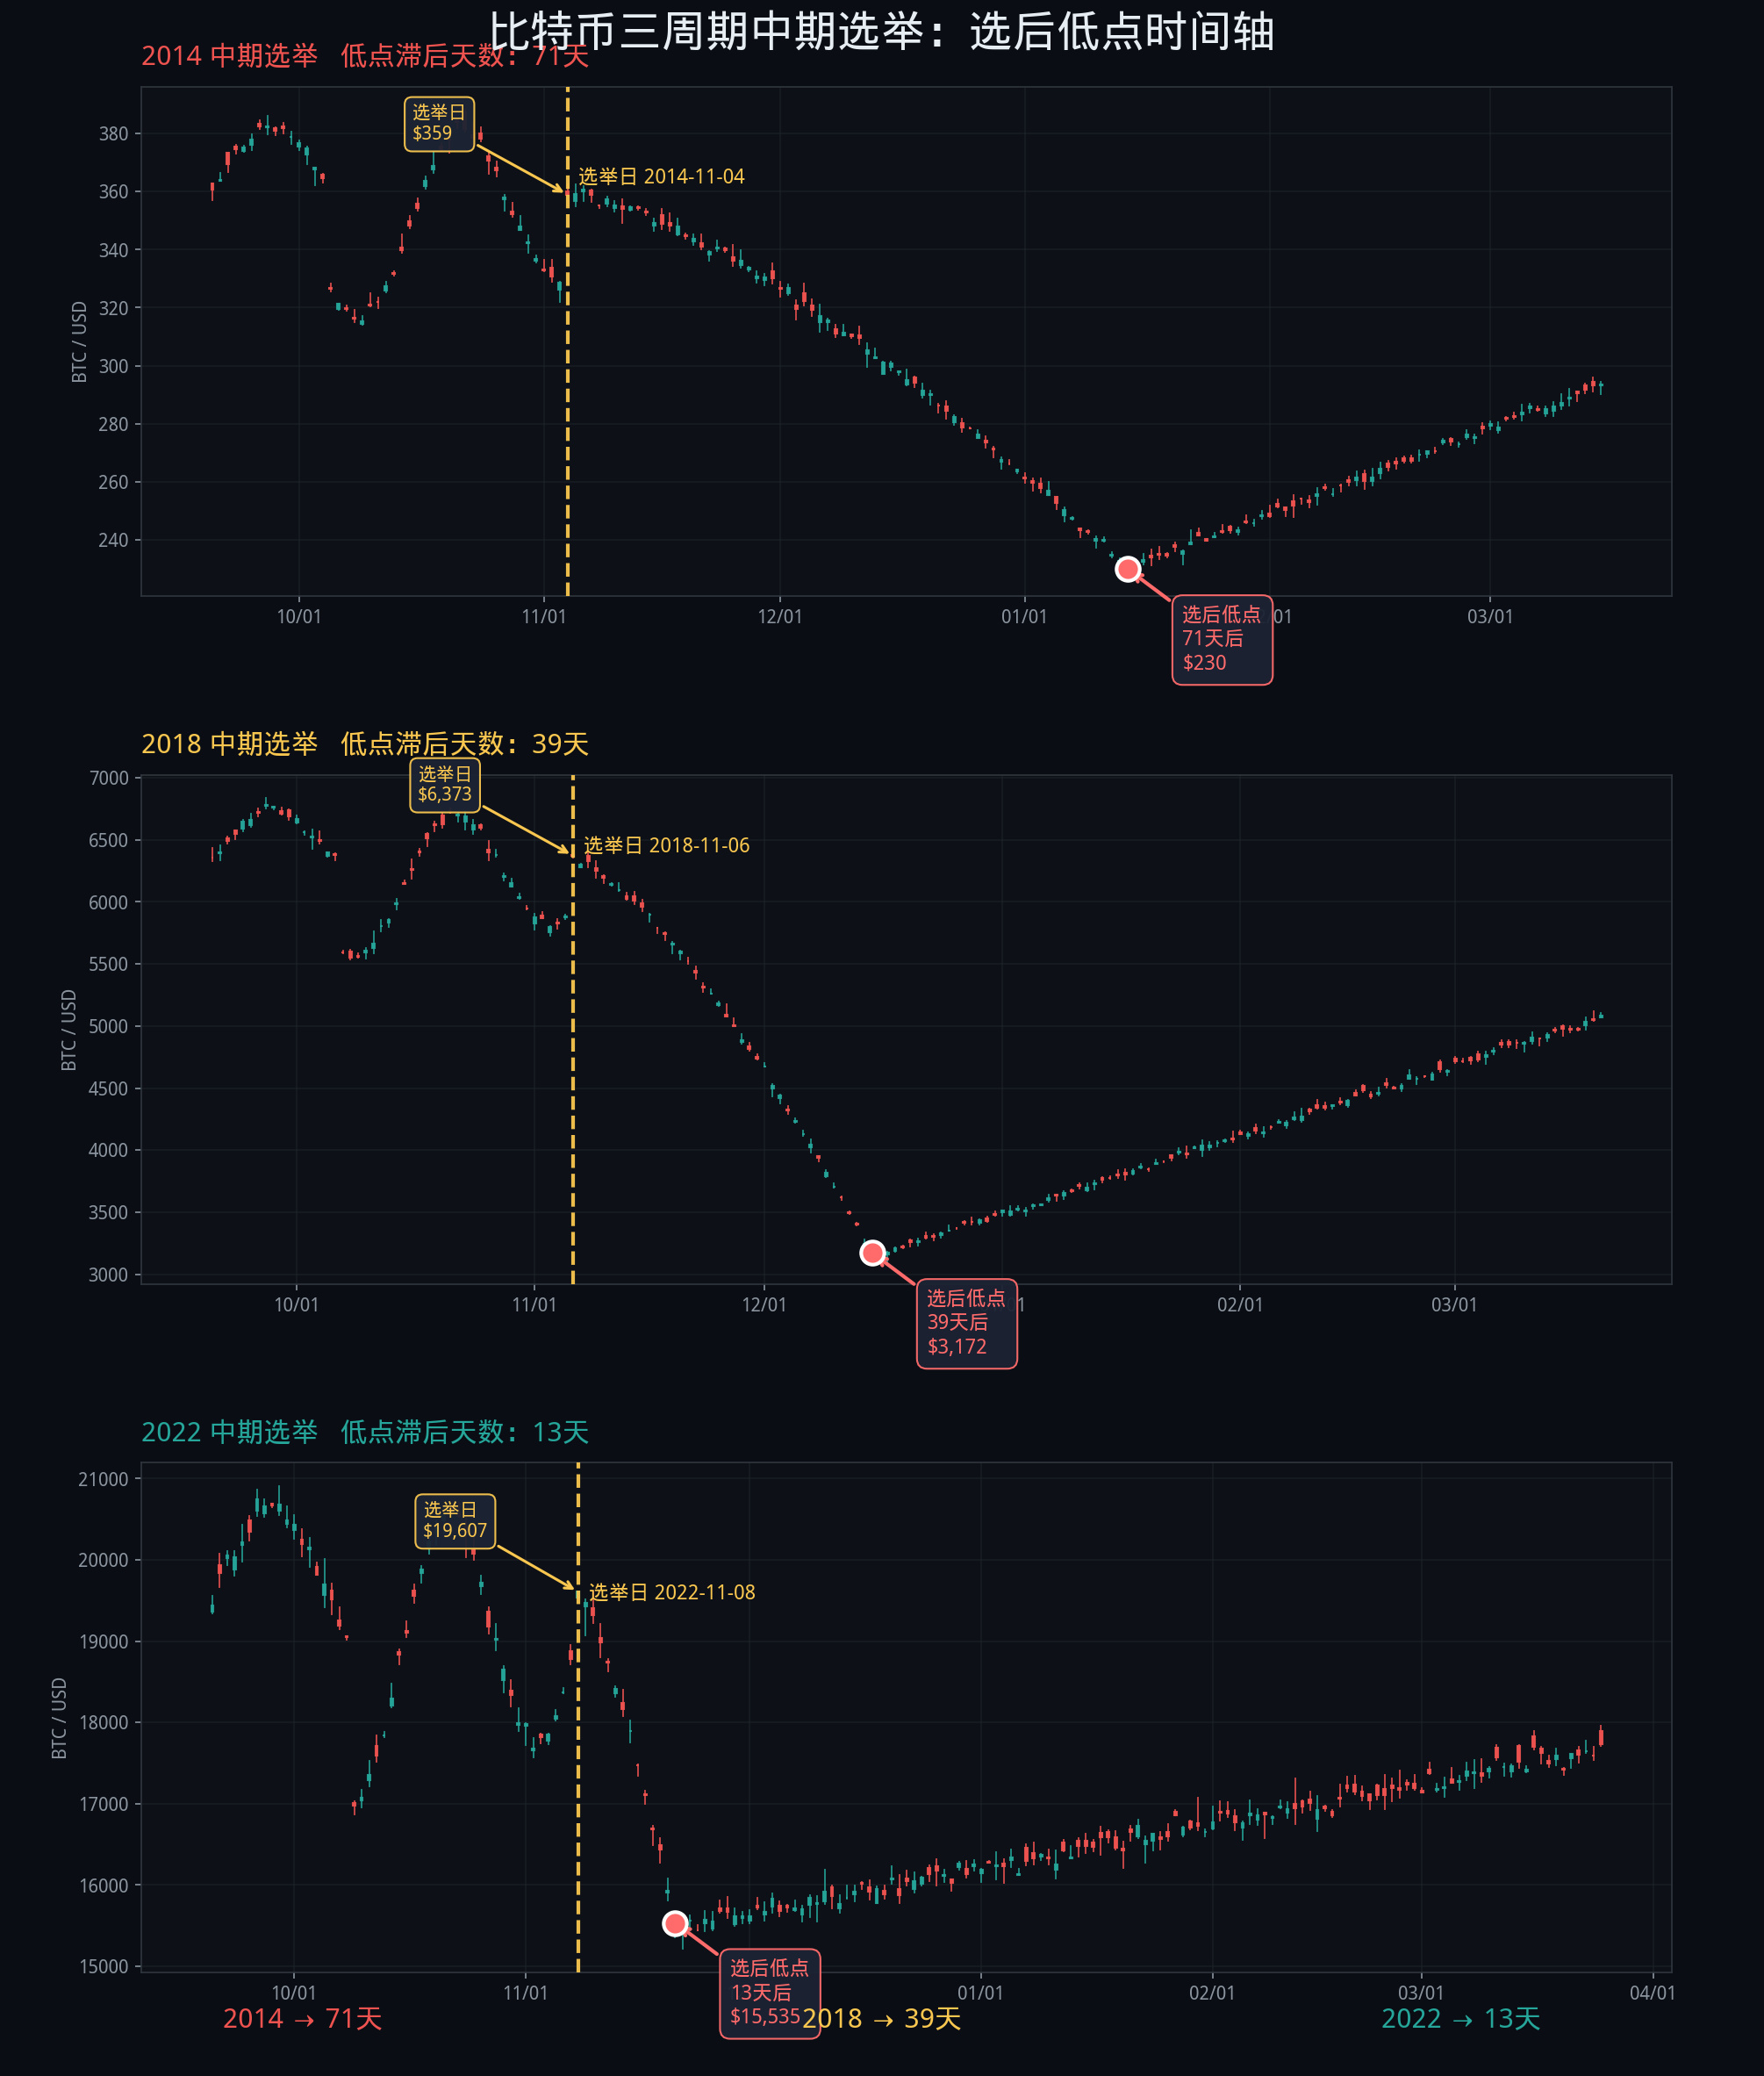
Across the last three midterm elections, BTC followed the same path: first a drop, then an accelerated washout, followed by a violent rebound.
📊 The data:
2014 (bottomed after 71 days)
Election day ~$360 → fell to $230 (-36%) → next bull market peak $20,000+
Rebound: +8,600%
2018 (bottomed after 39 days)
Election day ~$6,350 → fell to $3,150 (-50%) → 2019 rebound to $13,800
Rebound: +338%
2022 (bottomed after 13 days)
Election day ~$19,500 → fell to $15,500 (-21%) → broke its previous high at $73,750 in 2024
Rebound: +376%
🔑 Three patterns:
① The lag time to the bottom is shrinking: 71→39→13 (improving market-pricing efficiency)
② The deeper the drop, the stronger the rebound (in 2018, a 50% drop was followed by a 338% rebound)
③ Prices were higher than on election day in every case within 12 months after the election
🧭 What this means for 2026:
With ETF demand and a protection-fund mechanism now in place, the expected drawdown may be shallower and the bottom may come sooner. If prices retest lower levels after the election, that could instead be a window to position for the “final dip.”
History doesn’t repeat itself exactly, but it often rhymes.
$BTC
#美国中期选举:市场有哪些期待?
Across the last three midterm elections, BTC followed the same path: first a drop, then an accelerated washout, followed by a violent rebound.
📊 The data:
2014 (bottomed after 71 days)
Election day ~$360 → fell to $230 (-36%) → next bull market peak $20,000+
Rebound: +8,600%
2018 (bottomed after 39 days)
Election day ~$6,350 → fell to $3,150 (-50%) → 2019 rebound to $13,800
Rebound: +338%
2022 (bottomed after 13 days)
Election day ~$19,500 → fell to $15,500 (-21%) → broke its previous high at $73,750 in 2024
Rebound: +376%
🔑 Three patterns:
① The lag time to the bottom is shrinking: 71→39→13 (improving market-pricing efficiency)
② The deeper the drop, the stronger the rebound (in 2018, a 50% drop was followed by a 338% rebound)
③ Prices were higher than on election day in every case within 12 months after the election
🧭 What this means for 2026:
With ETF demand and a protection-fund mechanism now in place, the expected drawdown may be shallower and the bottom may come sooner. If prices retest lower levels after the election, that could instead be a window to position for the “final dip.”
History doesn’t repeat itself exactly, but it often rhymes.
$BTC
#美国中期选举:市场有哪些期待?