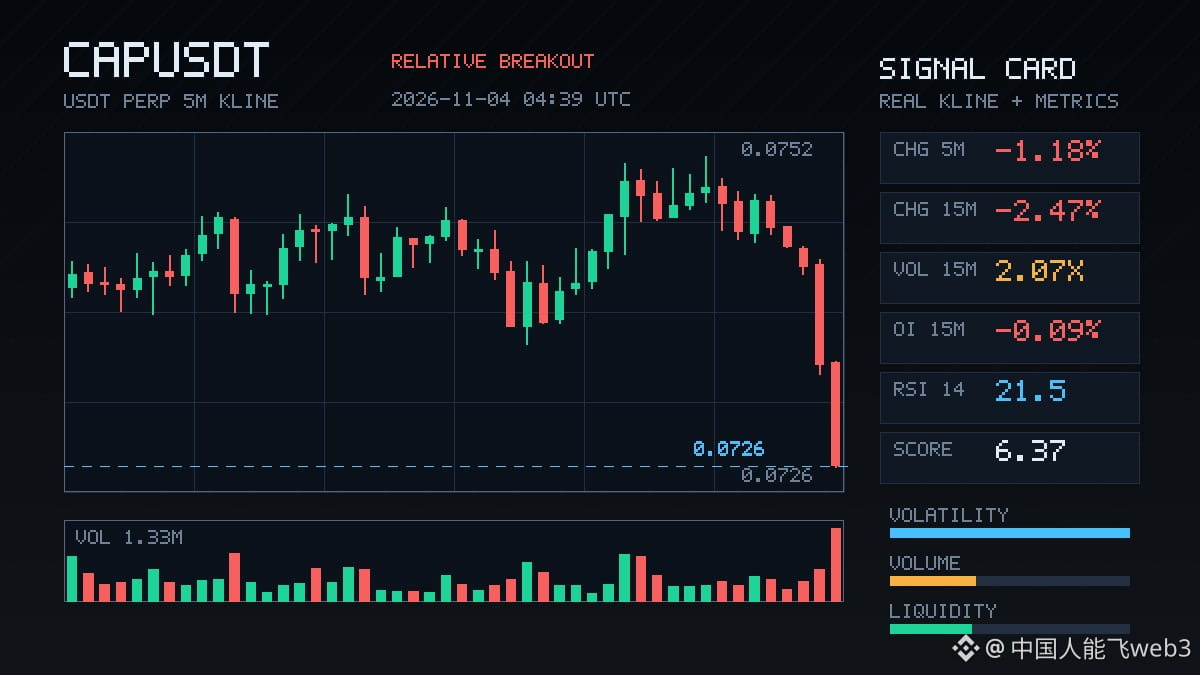
$CAP That was a pretty decisive sell-off: down 2.47% in 15m, with volume surging to 2.07x and a Z-score of 5.52. This isn’t normal volatility—someone is clearly distributing. The close broke below the lows of the last 20 5m candles, aggressive trade flow was -16.4%, and the buy/sell ratio was 0.72, showing a clear tilt toward selling pressure.
But what’s interesting is that OI is also falling: -0.09% over 15m and -0.12% over 1h, with more than 600K U in notional value. Price down + OI down looks more like longs deleveraging and stop-losses cascading than fresh shorts entering to drive the price down. The OI anomaly percentile is 97.2%, ranking #16 across the whole pool, and it’s persisted for several consecutive periods—so this isn’t a one-off move.
24h trading volume is only a little over 10M, and the pool is shallow, so slippage is likely at these levels. My take: first see whether this deleveraging wave can find support at the edge of the recent range. If it can’t, don’t rush to buy the dip below.
But what’s interesting is that OI is also falling: -0.09% over 15m and -0.12% over 1h, with more than 600K U in notional value. Price down + OI down looks more like longs deleveraging and stop-losses cascading than fresh shorts entering to drive the price down. The OI anomaly percentile is 97.2%, ranking #16 across the whole pool, and it’s persisted for several consecutive periods—so this isn’t a one-off move.
24h trading volume is only a little over 10M, and the pool is shallow, so slippage is likely at these levels. My take: first see whether this deleveraging wave can find support at the edge of the recent range. If it can’t, don’t rush to buy the dip below.