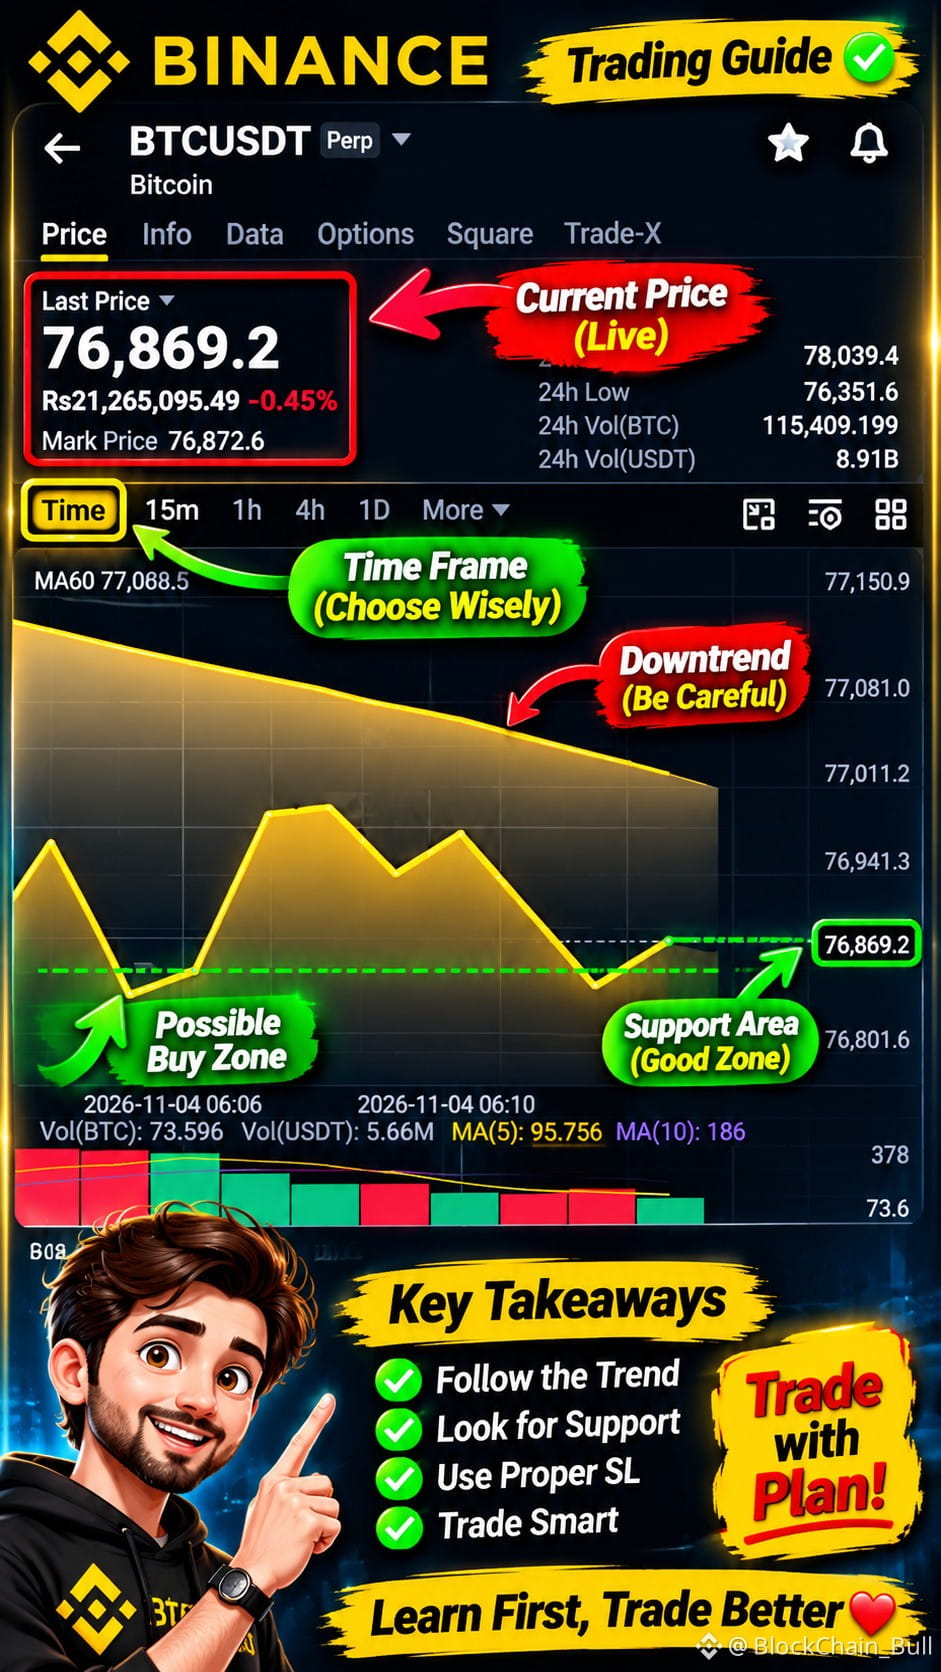
$BTC 📊 BTC/USDT Chart Analysis – Understand the Trend Before Trading!
Let's understand this Bitcoin chart in a simple way.
🔴 1. Market Trend The price is currently below the MA60 line. This suggests bearish pressure, so traders should be careful before considering a long position.
🟡 2. Current Price The displayed BTC price is around 76,869.2 USDT in this screenshot. Remember, market prices change constantly.
🟢 3. Possible Support Area The chart shows a recent low near 76,801.6. This may act as a short-term support area, but support is not guaranteed to hold.
📉 4. What Should Beginners Avoid?
Don't buy just because the price has dropped.
Don't enter a trade without confirmation.
Don't ignore the overall trend.
Never trade without a Stop Loss.
Don't risk money you cannot afford to lose.
📌 5. Smart Trading Lesson Wait for price confirmation, study the trend, check volume and use proper risk management. A possible support area is not automatically a Buy Signal.
❤️ Learn First. Analyze Carefully. Trade Responsibly.
This is educational chart analysis based on the screenshot, not a live trading signal or financial advice.
#BTCUSDT #bitcoin #cryptoeducation #TechnicalAnalysis #BinanceSquar
😍
Let's understand this Bitcoin chart in a simple way.
🔴 1. Market Trend The price is currently below the MA60 line. This suggests bearish pressure, so traders should be careful before considering a long position.
🟡 2. Current Price The displayed BTC price is around 76,869.2 USDT in this screenshot. Remember, market prices change constantly.
🟢 3. Possible Support Area The chart shows a recent low near 76,801.6. This may act as a short-term support area, but support is not guaranteed to hold.
📉 4. What Should Beginners Avoid?
Don't buy just because the price has dropped.
Don't enter a trade without confirmation.
Don't ignore the overall trend.
Never trade without a Stop Loss.
Don't risk money you cannot afford to lose.
📌 5. Smart Trading Lesson Wait for price confirmation, study the trend, check volume and use proper risk management. A possible support area is not automatically a Buy Signal.
❤️ Learn First. Analyze Carefully. Trade Responsibly.
This is educational chart analysis based on the screenshot, not a live trading signal or financial advice.
#BTCUSDT #bitcoin #cryptoeducation #TechnicalAnalysis #BinanceSquar
😍