
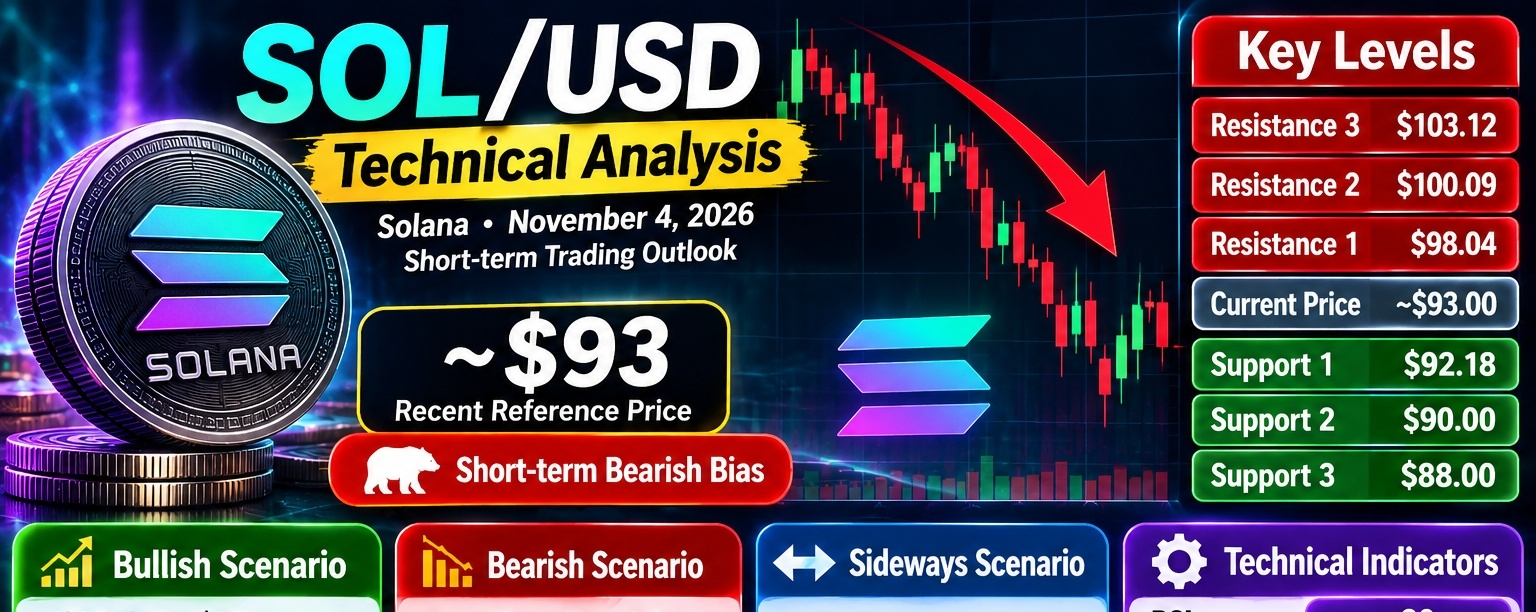

$SOL /USD Technical Analysis — November 4, 2026
Solana · Short-term trading outlook · USD

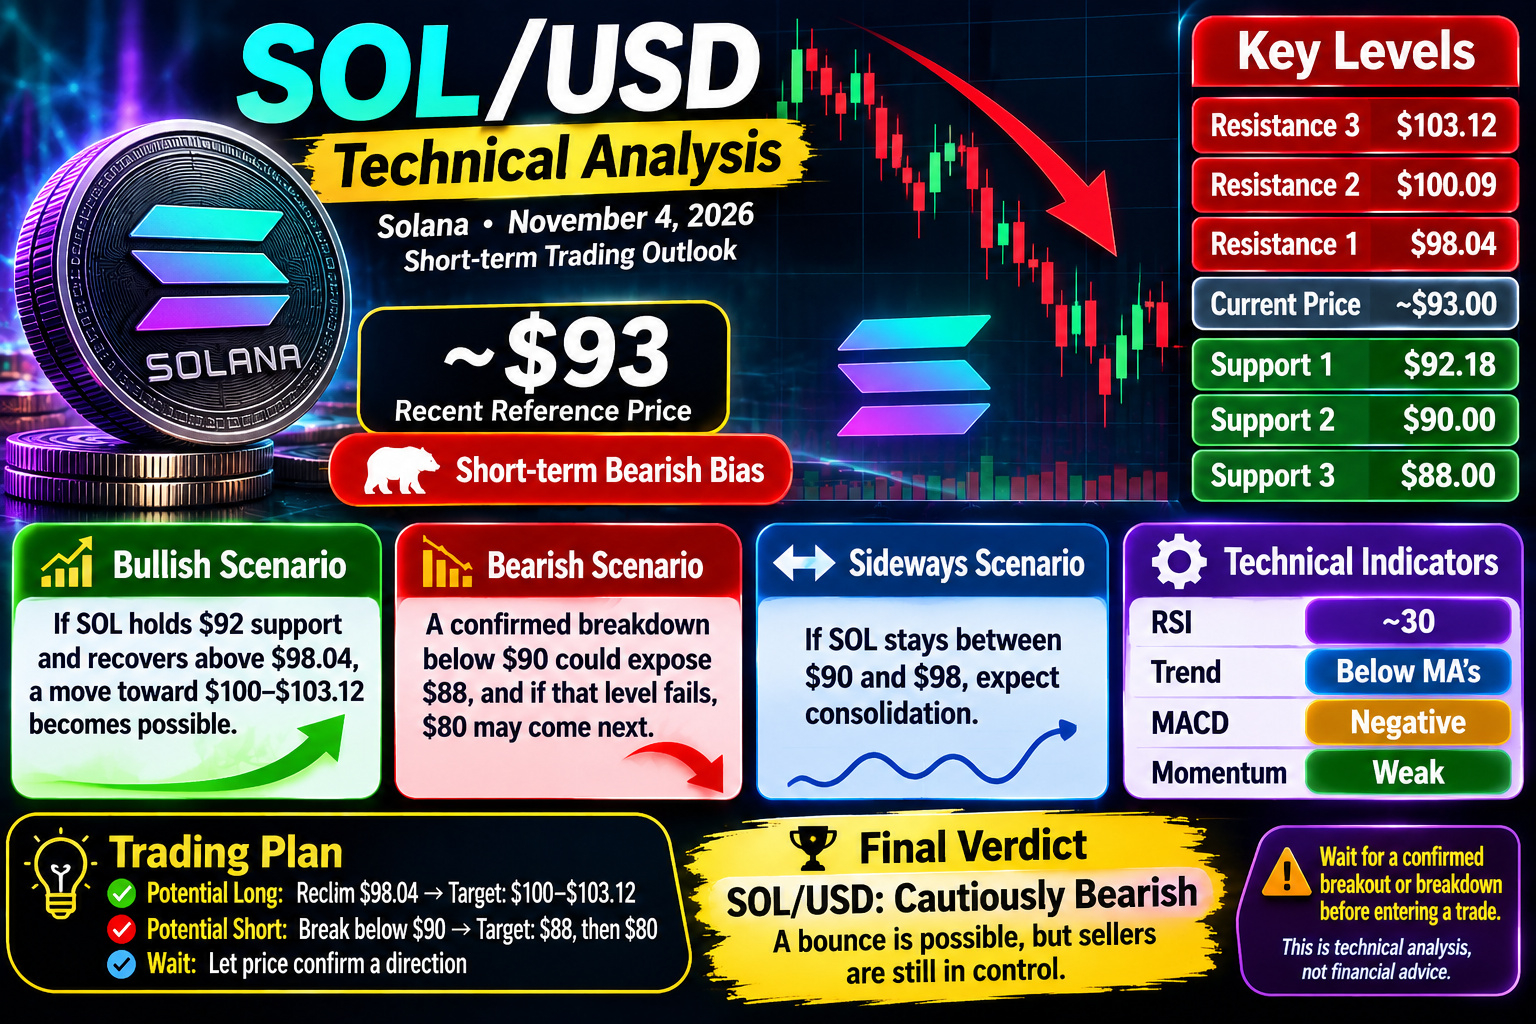
Solana is showing bearish short-term momentum, with the possibility of a relief bounce. Recent market data from November 3 placed SOL/USD around $93, after a substantial decline. SOL remains below key moving averages, while an RSI reading near 30 suggests selling pressure may be stretched. That can create bounce opportunities, but it does not confirm a reversal. Coin Edition +1

### ~$93
Recent reference price from November 3, not a verified live quote
Short-term bearish bias
### 1\. Key support and resistance levels
The following levels are based on recent technical analysis published November 3, 2026. Coin Edition +1
| Level | $SOL price (USD) | Significance |
| ----------------- | --------------- | -------------------------- |
| Resistance 3 | $103.12 | Stronger recovery hurdle |
| Resistance 2 | $100.09 | Major resistance zone |
| Resistance 1 | $98.04 | 200-day EMA recovery level |
| Current reference | ~$93.00 | Recent market area |
| Support 1 | $92.18 | Nearby technical support |
| Support 2 | $90.00 | Psychological support |
| Support 3 | $88.00 | Lower support zone |
### 2\. SOL/USD trading scenarios
Bullish scenario
If SOL holds the $92 support area and recovers above $98.04, a move toward $100–$103.12 becomes possible. A sustained breakout with stronger volume would improve the recovery outlook.
Bearish scenario
A confirmed breakdown below $90 could expose $88. If that level fails, $80 becomes a possible deeper downside target. Coin Edition +1
Sideways scenario
If SOL holds between $90 and $98, the market may consolidate while buyers and sellers compete for control.
### 3\. Technical indicators
* RSI: Around 30 in one recent daily technical snapshot, suggesting oversold conditions and the possibility of a short-term bounce. NAVI
* Moving averages: SOL remains below its 20-day and 50-day averages, indicating continued short-term weakness.
* MACD: Recent readings remain negative, suggesting bearish momentum has not fully reversed. Investing.com
* Market structure: The $92–$90 area is important for buyers to defend, while $98–$103 is the main recovery zone to watch.
### 4\. Potential trading plan
| Strategy | Confirmation | Potential target |
| --------------- | ------------------------------- | ------------------------- |
| Potential long | Reclaim and hold above $98.04 | $100–$103.12 |
| Potential short | Breakdown below $90 | $88, then potentially $80 |
| Wait-and-watch | Price stays between $90 and $98 | Wait for confirmation |
These are conditional scenarios, not guaranteed outcomes. Because SOL can move sharply, consider stop-loss placement, position sizing and the possibility of false breakouts.
### Final verdict
### SOL/USD: Cautiously bearish
Solana remains under short-term selling pressure, although oversold conditions could support a temporary recovery.
Bullish confirmation: Reclaim $98.04, followed by a sustained move above $100.
Bearish confirmation: Break below $90, increasing downside risk toward $88.
My preference: Wait for SOL to confirm a direction before entering a trade. A bounce from support is possible, but I would not treat oversold conditions alone as a buy signal.
This is technical market analysis for educational purposes, not pers
onalized financial advice. Prices and technical levels may change quickly.