#On-Chain Metrics Analysis
BTC: VDD and Median Price Model for Identifying Market Tops and Bottoms
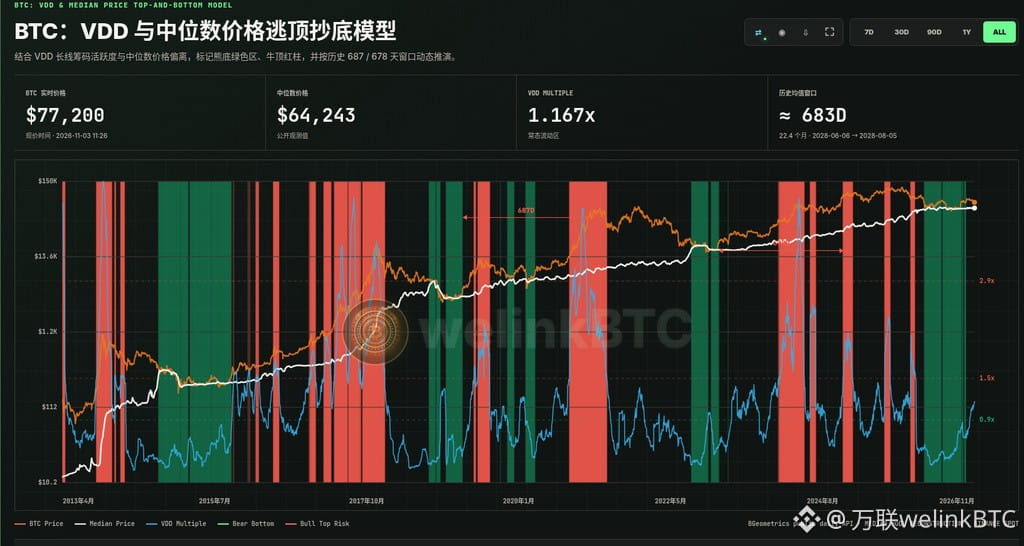
Combining long-term coin activity measured by VDD with deviations from the median price, this model marks bear-market bottoms with green zones and bull-market tops with red bars, and dynamically projects using historical 687- and 678-day windows. Low VDD combined with a price retest of the median marks a bear-market bottom; high VDD combined with a price well above the median signals top-distribution risk.
Current status · Bear-market bottom complete · Early stage of a new cycle
The latest daily VDD is 1.167x (within the normal circulation range), and the BTC / median price ratio is 1.20x; the median price is $64,243, and BTC's real-time price is approximately $77,200 (2026-11-03 11:26). Green-zone conditions: VDD < 0.9 and price multiple ≤ 1.25; red-bar conditions: VDD ≥ 1.5 and price multiple ≥ 1.5. The most recent green zone ended on 2026-08-24, about 71 days and 11 hours after the bear-market bottom ended. Based on the average of two reference samples, the midpoint of top-risk projections is 2028-07-06; the historical average window is about 683 days (about 22.4 months, approximately 2028-06-06→2028-08-05). On-chain date: 2026-11-02.
Historical references: 2019 cycle, 687 days (2019-04-02→2021-02-17, about 22.6 months); 2023 cycle, 678 days (2023-01-17→2024-11-25, about 22.3 months). The end of a green zone is only a potential starting point for a new macro cycle, and red bars are only risk warnings. Historical samples are limited, VDD and median prices may be revised, and cycle lengths may no longer hold. Continue to validate against spot demand, global liquidity, and long-term holder behavior. For cycle research only; this is not investment advice.
More selected on-chain cycle indicators
Portal
https://welinkbtc-onchainmain.xyz/
Understand cycles like a professional analyst
$BTC
BTC: VDD and Median Price Model for Identifying Market Tops and Bottoms
Combining long-term coin activity measured by VDD with deviations from the median price, this model marks bear-market bottoms with green zones and bull-market tops with red bars, and dynamically projects using historical 687- and 678-day windows. Low VDD combined with a price retest of the median marks a bear-market bottom; high VDD combined with a price well above the median signals top-distribution risk.
Current status · Bear-market bottom complete · Early stage of a new cycle
The latest daily VDD is 1.167x (within the normal circulation range), and the BTC / median price ratio is 1.20x; the median price is $64,243, and BTC's real-time price is approximately $77,200 (2026-11-03 11:26). Green-zone conditions: VDD < 0.9 and price multiple ≤ 1.25; red-bar conditions: VDD ≥ 1.5 and price multiple ≥ 1.5. The most recent green zone ended on 2026-08-24, about 71 days and 11 hours after the bear-market bottom ended. Based on the average of two reference samples, the midpoint of top-risk projections is 2028-07-06; the historical average window is about 683 days (about 22.4 months, approximately 2028-06-06→2028-08-05). On-chain date: 2026-11-02.
Historical references: 2019 cycle, 687 days (2019-04-02→2021-02-17, about 22.6 months); 2023 cycle, 678 days (2023-01-17→2024-11-25, about 22.3 months). The end of a green zone is only a potential starting point for a new macro cycle, and red bars are only risk warnings. Historical samples are limited, VDD and median prices may be revised, and cycle lengths may no longer hold. Continue to validate against spot demand, global liquidity, and long-term holder behavior. For cycle research only; this is not investment advice.
More selected on-chain cycle indicators
Portal
https://welinkbtc-onchainmain.xyz/
Understand cycles like a professional analyst
$BTC