Spot BTC ETFs saw $399 million in net outflows on Monday; IBIT’s $405 million outflow was its largest since June
On the first day of November, institutions took a step back—but prices didn’t follow suit and collapse. That’s the most noteworthy thing today.
First, the numbers—all from Monday’s session (November 2), and only gradually released today: U.S. spot $BTC ETFs saw combined net outflows of about $399 million, marking a second consecutive day of outflows. BlackRock’s IBIT alone saw $405.3 million flow out, its largest single-day outflow since June 26 ($444.5 million). Fidelity’s FBTC saw a modest $6.7 million inflow, offsetting only a small part of that. $ETH wasn’t much better: spot ETH ETFs saw about $140 million in outflows, their sixth consecutive day of outflows, while October’s monthly outflow set a record at $1.61 billion.
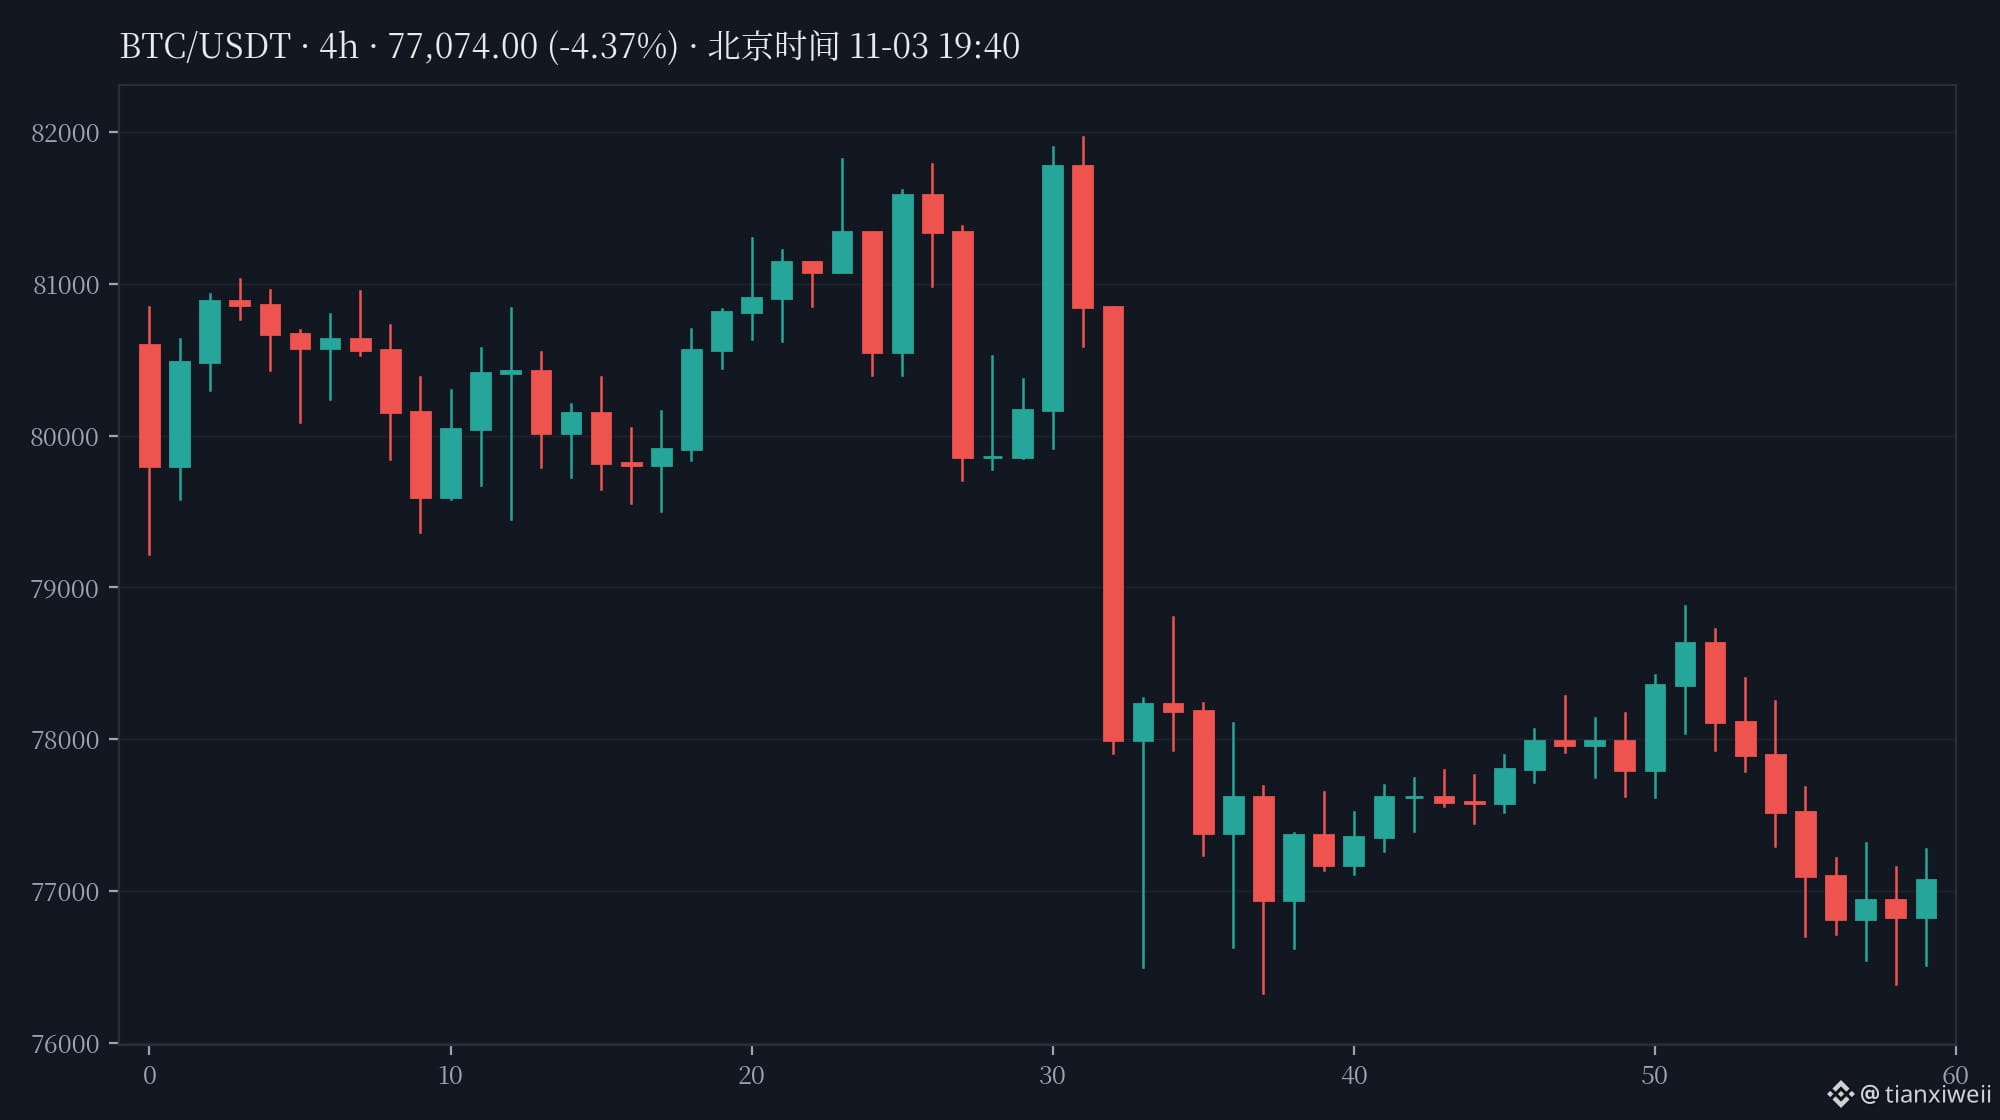
The interesting part, though, is that prices didn’t break down. Before publication (7:39 p.m. Beijing time, verified against two sources), BTC was around $77,076, down 1.04% over 24 hours. Its intraday low of $76,389 held—money was flowing out, but the market was still holding near $77,000. This looks more like portfolio rebalancing and risk reduction at the start of the month than panic selling.
My take: Don’t treat ETF outflows as a real-time order book—they’re a report on flows from the previous day. What really matters is whether outflows narrow or widen over the next two days. The levels to watch are straightforward: a close below $76,389 would point to weakening; only a move back above $77,620 would suggest stabilization and recovery.
Risk warning: This is only a review of publicly available fund flow data, not a recommendation to buy or sell. ETF data is delayed by one day, so don’t use it as an intraday signal.
What do you think: Is this just portfolio rebalancing at the start of November, or the beginning of a new wave of withdrawals?
#BTC #ETF #Binance
On the first day of November, institutions took a step back—but prices didn’t follow suit and collapse. That’s the most noteworthy thing today.
First, the numbers—all from Monday’s session (November 2), and only gradually released today: U.S. spot $BTC ETFs saw combined net outflows of about $399 million, marking a second consecutive day of outflows. BlackRock’s IBIT alone saw $405.3 million flow out, its largest single-day outflow since June 26 ($444.5 million). Fidelity’s FBTC saw a modest $6.7 million inflow, offsetting only a small part of that. $ETH wasn’t much better: spot ETH ETFs saw about $140 million in outflows, their sixth consecutive day of outflows, while October’s monthly outflow set a record at $1.61 billion.
The interesting part, though, is that prices didn’t break down. Before publication (7:39 p.m. Beijing time, verified against two sources), BTC was around $77,076, down 1.04% over 24 hours. Its intraday low of $76,389 held—money was flowing out, but the market was still holding near $77,000. This looks more like portfolio rebalancing and risk reduction at the start of the month than panic selling.
My take: Don’t treat ETF outflows as a real-time order book—they’re a report on flows from the previous day. What really matters is whether outflows narrow or widen over the next two days. The levels to watch are straightforward: a close below $76,389 would point to weakening; only a move back above $77,620 would suggest stabilization and recovery.
Risk warning: This is only a review of publicly available fund flow data, not a recommendation to buy or sell. ETF data is delayed by one day, so don’t use it as an intraday signal.
What do you think: Is this just portfolio rebalancing at the start of November, or the beginning of a new wave of withdrawals?
#BTC #ETF #Binance