#On-Chain Metrics Analysis
BTC: The Golden Cross of the “Short-Term Holder Cost Basis” and the “200-Day Moving Average”
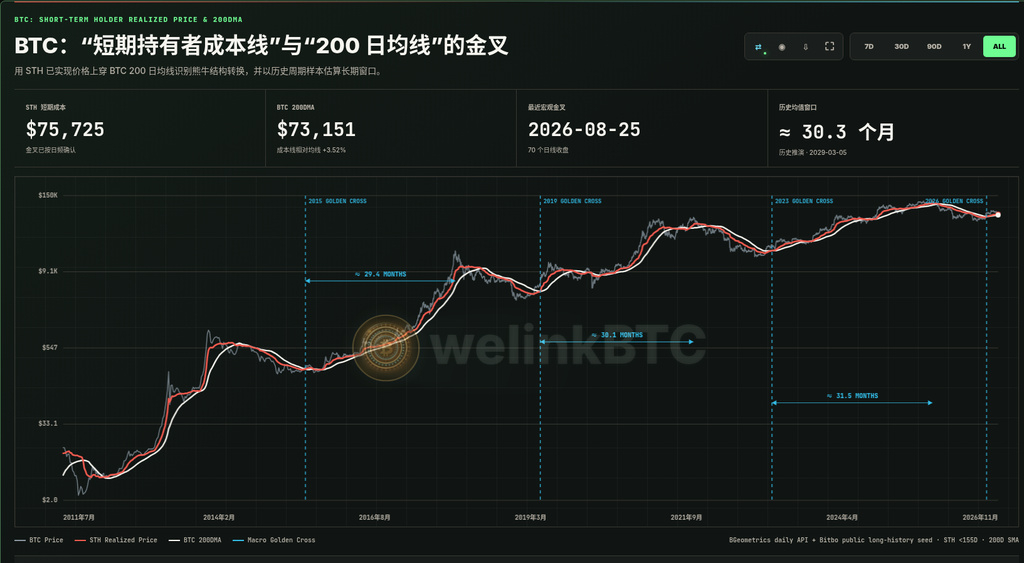
Use the STH Realized Price crossing above BTC’s 200-day moving average to identify structural transitions between bear and bull markets, and estimate long-term windows using historical cycle samples. The red line represents the average on-chain cost basis of holders who have held for fewer than 155 days; the black line is the 200-day simple moving average of BTC’s daily price. When the red line crosses above the black line and closes above it consistently, this typically signals a shift from a bear-market bottoming structure to a macro expansion phase.
Current status · Macro golden cross confirmed
Public daily data shows the STH cost basis at $75,725 and the 200DMA at $73,151, with the cost basis 3.52% above the moving average. The most recent macro golden cross occurred on 2026-08-25. As of 2026-11-02, it had remained above the moving average for 70 consecutive daily observations (approximately 70 days and 11 hours since the golden cross). The average time to peak across the 3 complete historical samples was approximately 30.3 months, pointing to a projected date of around 2029-03-05 based on historical patterns.
Historical references: The 2015 golden cross took approximately 29.4 months (2015-07-05→2017-12-16, 895 days); the 2019 golden cross took approximately 30.1 months (2019-05-08→2021-11-08, 915 days); and the 2023 golden cross took approximately 31.5 months (2023-02-20→2025-10-06, 959 days). A macro golden cross is a structural signal, not a short-term buy or sell instruction. It should be assessed alongside spot demand, global liquidity, holder profit-taking, and price trends. Keep in mind the small number of historical samples, potential data revisions, and the possibility that cycles may no longer hold. For cycle research only; this is not investment advice.
More selected on-chain cycle metrics
Portal
https://welinkbtc-onchainmain.xyz/
Understand cycles like a professional analyst
$BTC
BTC: The Golden Cross of the “Short-Term Holder Cost Basis” and the “200-Day Moving Average”
Use the STH Realized Price crossing above BTC’s 200-day moving average to identify structural transitions between bear and bull markets, and estimate long-term windows using historical cycle samples. The red line represents the average on-chain cost basis of holders who have held for fewer than 155 days; the black line is the 200-day simple moving average of BTC’s daily price. When the red line crosses above the black line and closes above it consistently, this typically signals a shift from a bear-market bottoming structure to a macro expansion phase.
Current status · Macro golden cross confirmed
Public daily data shows the STH cost basis at $75,725 and the 200DMA at $73,151, with the cost basis 3.52% above the moving average. The most recent macro golden cross occurred on 2026-08-25. As of 2026-11-02, it had remained above the moving average for 70 consecutive daily observations (approximately 70 days and 11 hours since the golden cross). The average time to peak across the 3 complete historical samples was approximately 30.3 months, pointing to a projected date of around 2029-03-05 based on historical patterns.
Historical references: The 2015 golden cross took approximately 29.4 months (2015-07-05→2017-12-16, 895 days); the 2019 golden cross took approximately 30.1 months (2019-05-08→2021-11-08, 915 days); and the 2023 golden cross took approximately 31.5 months (2023-02-20→2025-10-06, 959 days). A macro golden cross is a structural signal, not a short-term buy or sell instruction. It should be assessed alongside spot demand, global liquidity, holder profit-taking, and price trends. Keep in mind the small number of historical samples, potential data revisions, and the possibility that cycles may no longer hold. For cycle research only; this is not investment advice.
More selected on-chain cycle metrics
Portal
https://welinkbtc-onchainmain.xyz/
Understand cycles like a professional analyst
$BTC