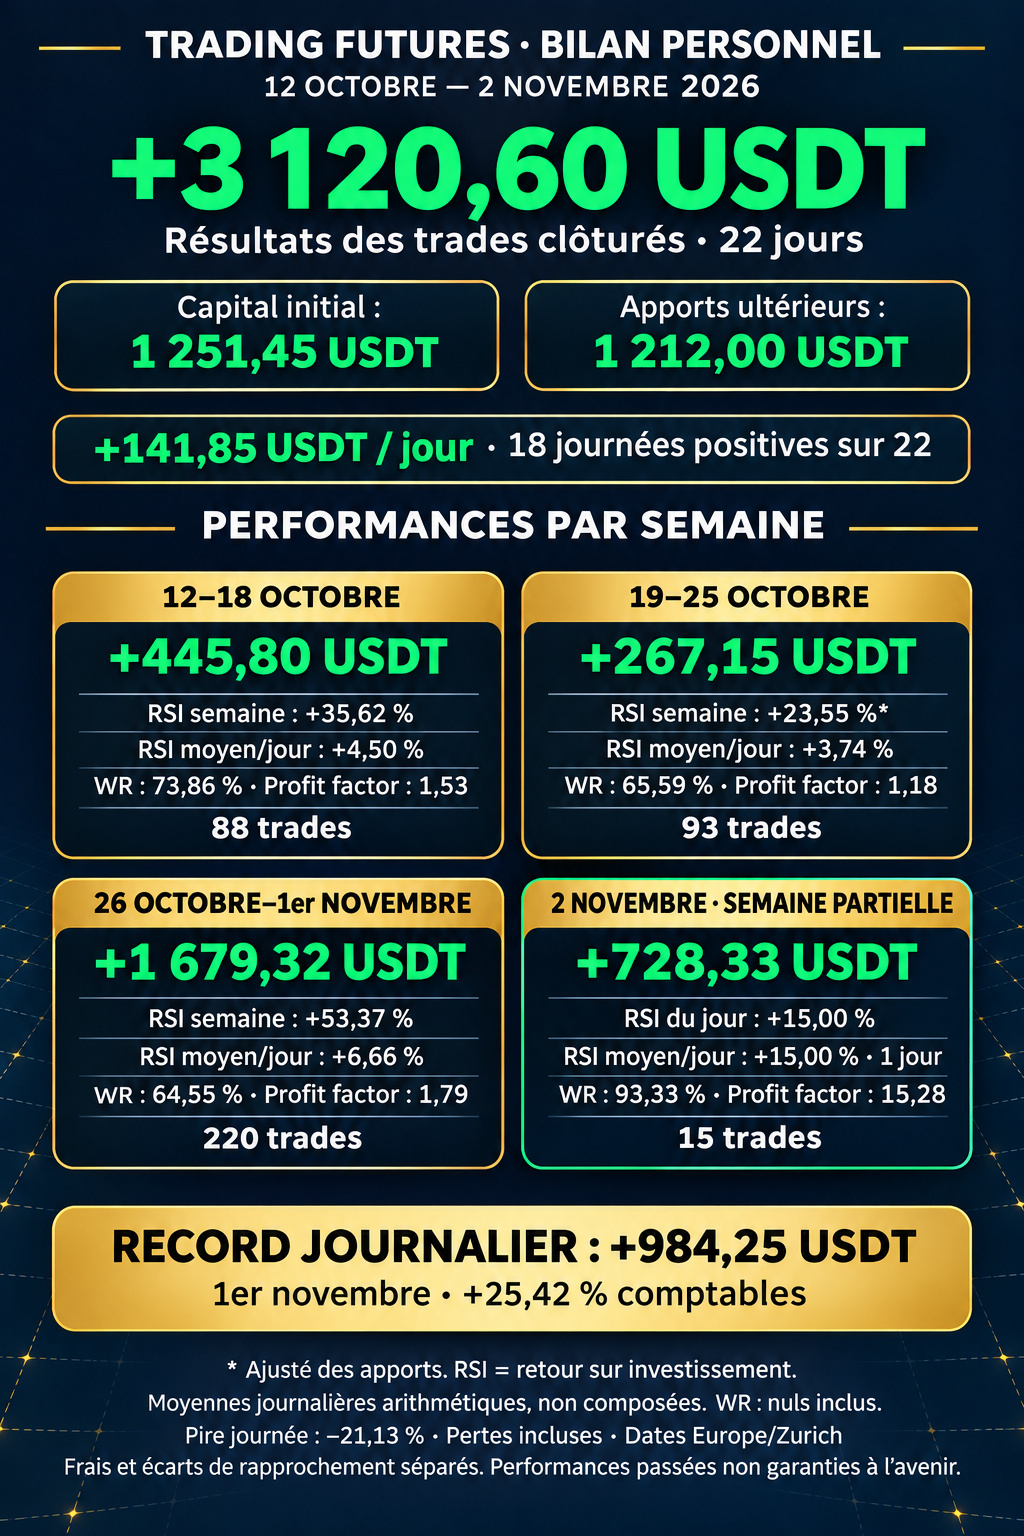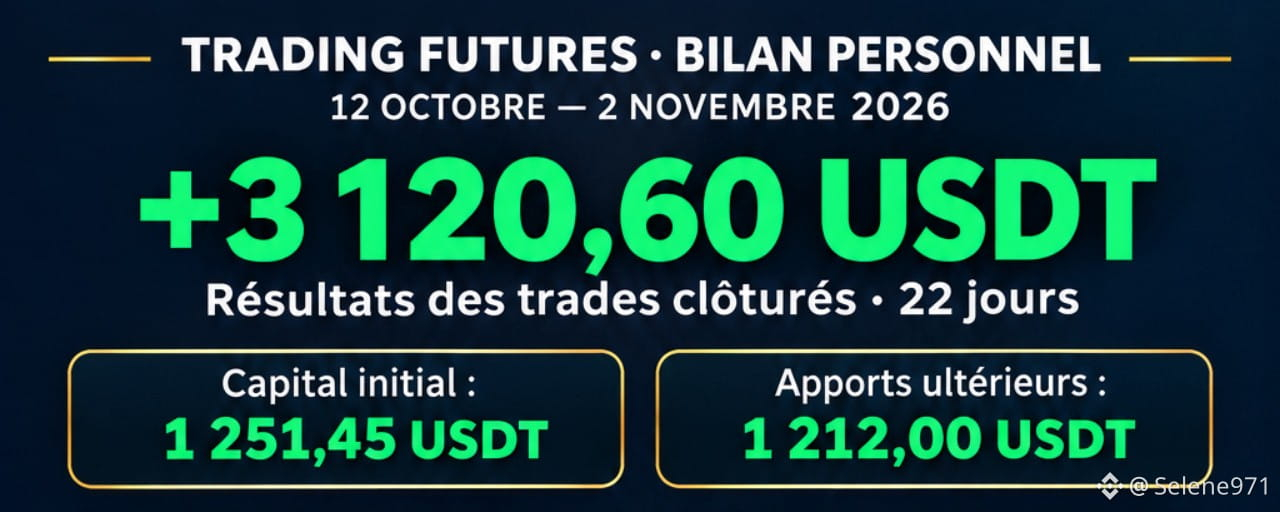

Review from October 12 to November 2, 2026 · 22 days
In my previous v6.3 report, I reported +5.17% over 7 days of active trading.
Since then, my approach has evolved: a more targeted selection of movements, more observation before entering, and active management of Futures grids.
🔎 WHAT HAS CHANGED
I look for quiet phases followed by an exceptional acceleration in price and executed buys. I then wait for buying pressure to fade and for the first signs of a downturn to appear on the one-minute candles.
My goal: to take advantage of back-and-forth movements with a fine grid, while also benefiting from directional movement when it is confirmed.
💰 CAPITAL AND KEY FIGURES
Starting capital on October 12: 1 251,45 USDT, according to the reconstructed accounting baseline.
Additional deposits after close on October 22: 1 212,00 USDT.
Total initial capital + deposits: 2 463,45 USDT. Deposits are not gains.
🟢 +3 120,60 USDT in results from closed trades
📅 +141,85 USDT average per day, including losses
📈 +5,42 % average arithmetic daily ROI, not compounded
✅ 18 positive days out of 22
🎯 15 out of 22 days at +3 % or more
🔢 416 closed trades
📊 WEEKLY PERFORMANCE
ROI = return on investment, not the technical indicator.
🟢 OCTOBER 12–18
💰 Closed P/L: +445,80 USDT
📈 Weekly ROI: +35,62 %
📅 Average daily ROI: +4,50 %
✅ Win rate: 73,86 %
⚖️ Profit factor: 1,53
🔢 88 trades: 65 winners / 17 losers / 6 breakeven
🟢 OCTOBER 19–25
💰 Closed P/L: +267,15 USDT
📈 Weekly ROI adjusted for deposits: +23,55 %
📅 Average daily ROI: +3,74 %
✅ Win rate: 65,59 %
⚖️ Profit factor: 1,18
🔢 93 trades: 61 winners / 30 losers / 2 breakeven
🟢 OCTOBER 26–NOVEMBER 1
💰 Closed P/L: +1 679,32 USDT
📈 Weekly ROI: +53,37 %
📅 Average daily ROI: +6,66 %
✅ Win rate: 64,55 %
⚖️ Profit factor: 1,79
🔢 220 trades: 142 winners / 74 losers / 4 breakeven
🟡 CURRENT WEEK — NOVEMBER 2 ONLY
💰 Closed P/L: +728,33 USDT
📈 Daily accounting ROI: +15,00 %
📅 Average daily ROI: +15,00 % over a single day
✅ Win rate: 93,33 %
⚖️ Profit factor: 15,28
🔢 15 trades: 14 winners / 1 loser / 0 breakeven
Average across the three full weeks: +797,42 USDT per week.
🏆 MY RECORDS FOR THIS PERIOD
🥇 Best day: +984,25 USDT on November 1, or +25,42 % against the day's accounting baseline.
🥇 Best week: +1 679,32 USDT and +53,37 % from October 26 to November 1.
🥇 Best trade: IRYS, +267,93 USDT.
🔬 TWO EXAMPLES OF MY NEW APPROACH
ON: +487,71 USDT realized across four shorts. On the last two, the latest active snapshot showed 59 pairs and +174,26 USDT paired. The oscillations therefore genuinely contributed to the result.
CYS: three shorts closed for +238,59 USDT.
📌 HOW TO READ THESE FIGURES
• Average daily ROI: arithmetic mean of daily accounting returns, including losses. It is neither a compounded return nor the weekly ROI divided by seven.
• Win rate: winning trades ÷ all closed trades, including breakeven results.
• Profit factor: total gains ÷ the absolute value of total losses.
• Weekly ROIs follow the dashboard valuations, adjusted for deposits when necessary. Trade P/L and portfolio returns may differ due to accounting reconciliations.
⚠️ TRANSPARENCY
The worst day is still included in full: −849,21 USDT on October 24, or −21,13 %, including one trade at −700 USDT.
These results come from my personal journal. Returns use reconstructed accounting baselines; days are based on the opening date in Europe/Zurich. Not all fees and separate reconciliation differences are included in trade results: this is not an audited net return after all fees.
The periods, capital, and methods differ from my previous report: this comparison illustrates my progress, without proving superiority at equal risk.
My goal remains an average of +3 % per day. These results are encouraging; consistency is still a work in progress.
Past performance does not guarantee future results.
#TradingJournal #Future #TradingBots