


Brent Crude Falls Amid Structural Market Weakness
Recently, Brent crude prices plunged sharply, but this positive development failed to halt the declines in Bitcoin and U.S. stocks as expected—particularly in the Nasdaq semiconductor sector. When oil prices fall, concerns about near-term inflation should ease, in turn reducing expectations of aggressive rate hikes. Yet U.S. stocks and crypto markets continued to move firmly lower. This suggests that the short-term pullback in oil prices cannot fundamentally resolve the structural problems facing the semiconductor sector and Bitcoin.
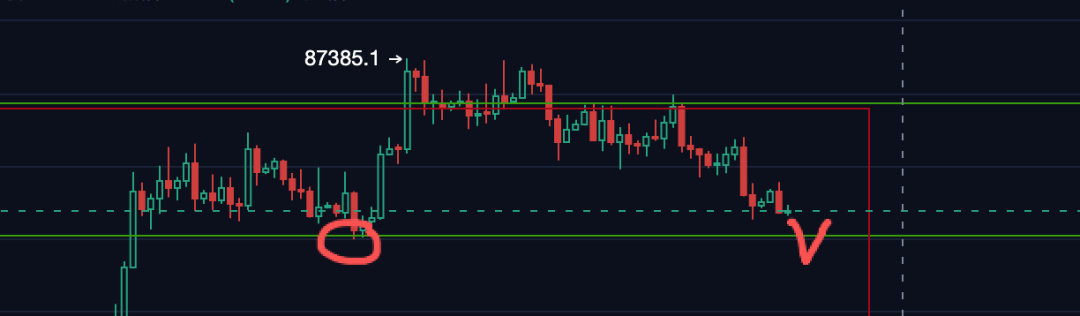
On the daily chart, bearish pressure remains strong. The market had been hoping for a powerful short squeeze in Bitcoin and the Nasdaq. If price had filled the gap overhead on a lower timeframe—around $80,000 or $82,500, for example—that would have created an ideal fakeout-and-drop setup for shorting at higher levels. But the rebound fell far short of expectations, and the broader market plunged sharply after merely testing a key support-resistance flip level. This shows that the market is extremely weak, making a liquidity sweep below increasingly likely.
Two Possible Scenarios for Bitcoin’s Next Moves
To assess Bitcoin’s future price action, we need to watch how movements in U.S. stocks affect it and prepare for two possible scenarios:
· Scenario 1: A rebound after retesting key moving averages (the more likely, moderate scenario)
If U.S. stocks break below support at a structural low but quickly reclaim the support-resistance flip level, Bitcoin may also briefly wick below around $75,000 and the 200-day EMA before recovering and beginning a rebound. This pattern closely resembles the early stages of the previous bull market, when price broke below a prior structural low, found support at the 200-day MA, and quickly reversed. If this scenario plays out, both the Nasdaq and Bitcoin could see a strong rebound.
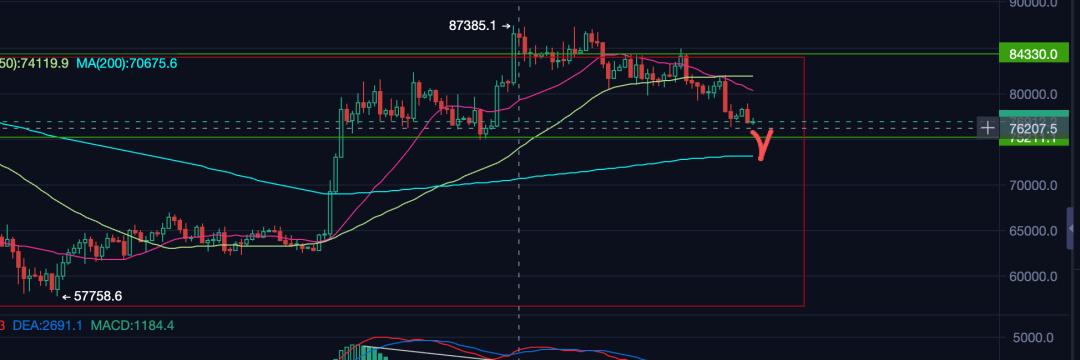
· Scenario 2: An AI bubble bursts and the trading range breaks down (the highly bearish scenario)
If the Nasdaq fails to hold the support-resistance flip level and the AI sector experiences a burst of its cyclical bubble, Bitcoin will face a serious test as well. If we view its price action as a trading range, a failure of support at $75,000 and the 200-day moving average could trigger a deep market correction, potentially taking Bitcoin below $57,700 and to new lows. That would bring the early bull-market pattern to an end, and the market may have to face a second test similar to the one that followed the black swan events of late 2022.
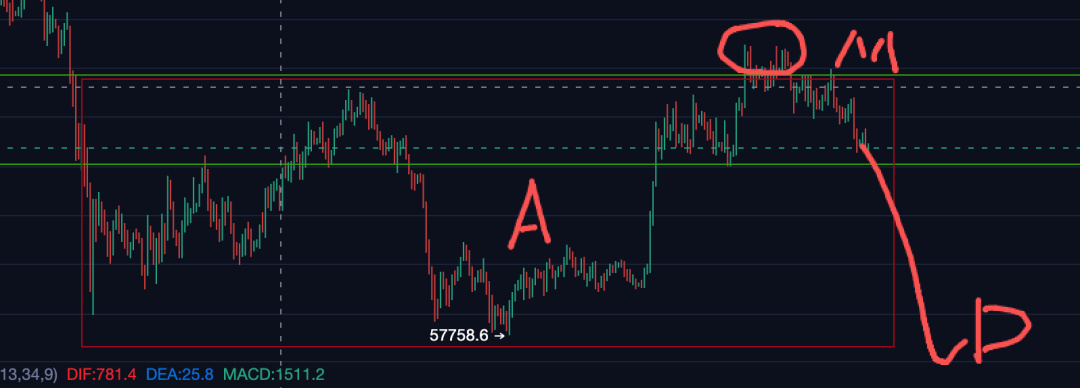
Based on the available data, Lao K estimates the chance of a complete AI bubble collapse at no more than 25%; a cyclical washout of positions is more likely. Even so, under current conditions, Bitcoin is still likely to dip into the $73,000–$75,000 range, and it may be too soon to say that the near-term downtrend is over.
A Potential Rebound Based on Midterm Election History
To explore whether there is hope for a near-term market lift, let’s look at historical data. A review of the 13 U.S. midterm elections since 1974 shows that:
S&P 500: In the week after the election, the index fell only three times; gains were the norm.
Nasdaq: Since 1990, the index has fallen only once in the week following a midterm election.
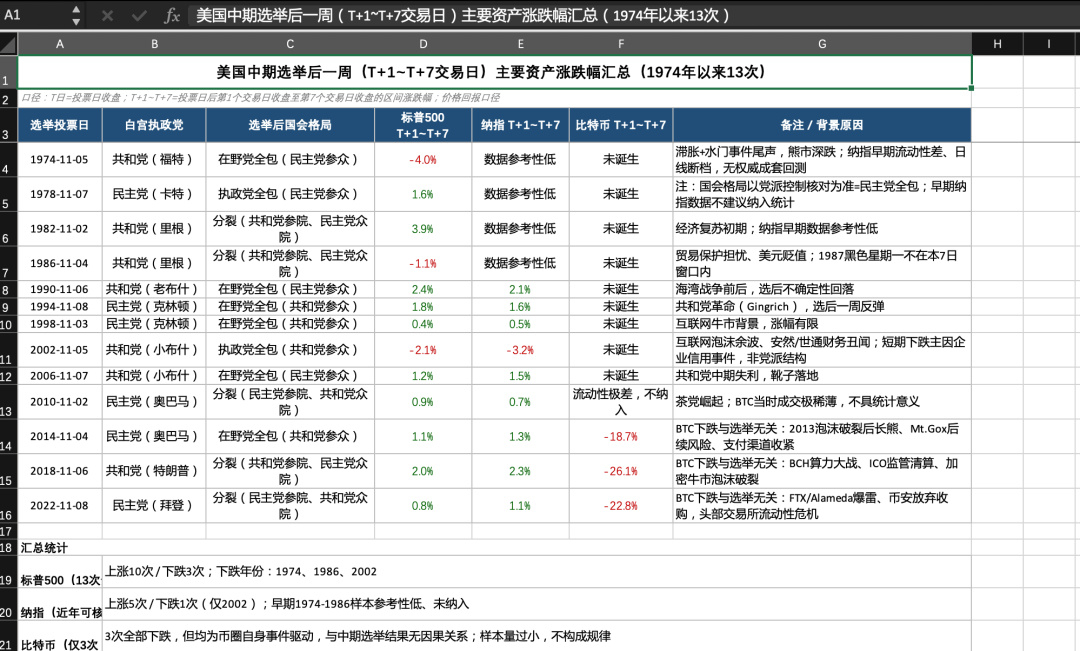
Historical data suggests that once midterm elections are over, uncertainty around the political landscape and policy drops significantly, often giving market sentiment an immediate boost. In addition, markets typically have already fallen in the lead-up to midterm elections, making an oversold rebound afterward highly likely.
As for the claim by some investors that “Bitcoin has plunged after each of the last three midterm elections,” we need to understand the real reasons behind those declines. The 2014 drop followed the end of the 2013 bull market and the Mt. Gox incident; the 2018 decline was driven by the BCH hashrate war; and the 2022 plunge followed the FTX collapse. All of these were black swan events within the crypto industry, with no direct causal link to the midterm elections themselves. That’s why U.S. stock indexes remain the most useful reference points at this stage.
Trading Strategy and Cross-Asset Dynamics: A Precisely Timed Gold Long
Given the current market structure, if a rebound follows the midterm elections, it should be viewed as an opportunity to exit long positions or adjust exposure as a risk-management measure—not as a time to chase prices higher. With bears firmly in control, blindly chasing shorts or entering at a poor price can leave traders vulnerable to an oversold rebound. Take altcoins such as NEAR and UNI: although the overall outlook is bearish, if the market doesn’t offer an ideal high-level entry, it may be wiser to tactically forgo part of the move, preserve ample capital, and look for high-quality long opportunities at lower levels.

By contrast, cross-asset markets are presenting clear trading opportunities. In our show the other day, we flagged the opportunity to go long on gold after it recovered from a false break below $3,900. Oil’s subsequent plunge eased expectations of inflation-driven rate hikes, helping gold and other non-yielding assets rise against the trend.
Our first take-profit target of $3,960 on the gold long we flagged in advance in our public community has now been reached precisely! We’ll continue to monitor price action and assess the trade as it develops, including the second target and the potential for a further rebound.