# On-Chain Metrics Analysis
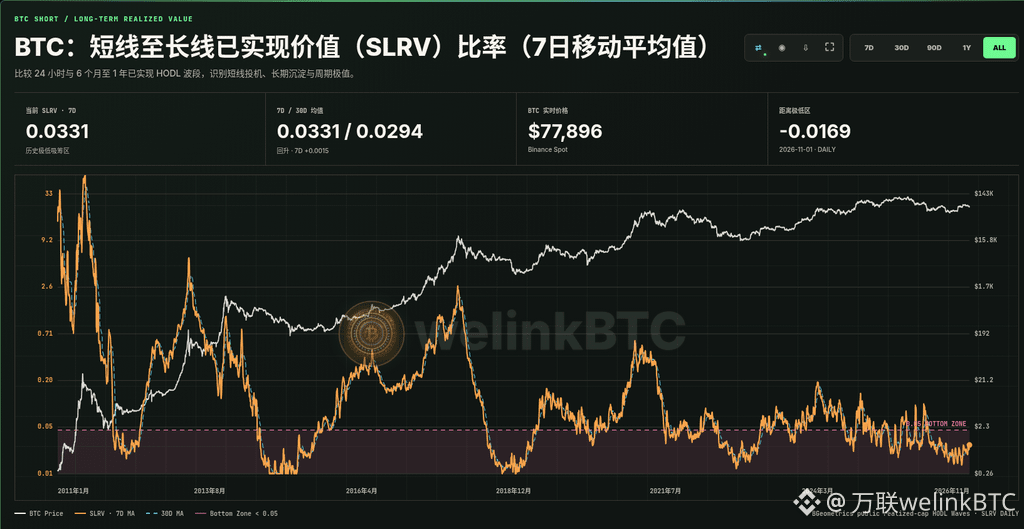
BTC: Short-Term to Long-Term Realized Value (SLRV) Ratio (7-Day Moving Average)
SLRV = 24-hour realized HODL wave ÷ 6-month to 1-year realized HODL wave, with a 7-day moving average applied to the daily ratio. It compares the relative strength of short-term speculative flows and medium- to long-term coin accumulation, helping identify cyclical extremes.
Current status · Historical extreme-low accumulation zone · 7D SLRV 0.0331
The current 7-day average SLRV is 0.0331, entering the historical extreme-low zone below 0.05; the 30-day average is 0.0294. Short-term speculative flows have contracted significantly, and the coin structure is leaning more toward accumulation. 7-day change: +0.0015 (rebounding); raw daily ratio: 0.0221. The current stretch in the historical extreme-low zone has lasted 30 days; distance from the extreme-low threshold: −0.0169. On-chain date: 2026-11-01. BTC spot price: approximately $77,896 (Binance Spot).
Historical references: Recent extreme-low zone examples include 2025-07-22→2025-08-22 (low of 0.0234, 32 days), 2025-10-01→2025-11-18 (0.0295, 49 days), and 2025-11-29→2026-01-08 (0.0291, 41 days); the current cycle, from 2026-02-12 through 2026-11-01, has a low of 0.0190 and has lasted 263 days so far (ongoing). Zones: <0.05 historical extreme-low zone (speculation cooling; watch for long-term accumulation), 0.05–1.0 normal equilibrium, 1.0–3.0 rising activity, >3.0 overheated distribution. Historical lows are not single-day buy-the-dip signals; they are better viewed as structural windows in which speculative excess is persistently compressed. Long-term accumulation signals are more reliable when a low SLRV is accompanied by recovering spot demand, support from realized price, and improving liquidity. For cyclical research only; not investment advice.
More curated on-chain cycle indicators
Portal
https://welinkbtc-onchainmain.xyz/
Understand market cycles like a professional analyst
$BTC
BTC: Short-Term to Long-Term Realized Value (SLRV) Ratio (7-Day Moving Average)
SLRV = 24-hour realized HODL wave ÷ 6-month to 1-year realized HODL wave, with a 7-day moving average applied to the daily ratio. It compares the relative strength of short-term speculative flows and medium- to long-term coin accumulation, helping identify cyclical extremes.
Current status · Historical extreme-low accumulation zone · 7D SLRV 0.0331
The current 7-day average SLRV is 0.0331, entering the historical extreme-low zone below 0.05; the 30-day average is 0.0294. Short-term speculative flows have contracted significantly, and the coin structure is leaning more toward accumulation. 7-day change: +0.0015 (rebounding); raw daily ratio: 0.0221. The current stretch in the historical extreme-low zone has lasted 30 days; distance from the extreme-low threshold: −0.0169. On-chain date: 2026-11-01. BTC spot price: approximately $77,896 (Binance Spot).
Historical references: Recent extreme-low zone examples include 2025-07-22→2025-08-22 (low of 0.0234, 32 days), 2025-10-01→2025-11-18 (0.0295, 49 days), and 2025-11-29→2026-01-08 (0.0291, 41 days); the current cycle, from 2026-02-12 through 2026-11-01, has a low of 0.0190 and has lasted 263 days so far (ongoing). Zones: <0.05 historical extreme-low zone (speculation cooling; watch for long-term accumulation), 0.05–1.0 normal equilibrium, 1.0–3.0 rising activity, >3.0 overheated distribution. Historical lows are not single-day buy-the-dip signals; they are better viewed as structural windows in which speculative excess is persistently compressed. Long-term accumulation signals are more reliable when a low SLRV is accompanied by recovering spot demand, support from realized price, and improving liquidity. For cyclical research only; not investment advice.
More curated on-chain cycle indicators
Portal
https://welinkbtc-onchainmain.xyz/
Understand market cycles like a professional analyst
$BTC