PONS rebounds, but buying pressure is insufficient; the uptrend remains unconfirmed
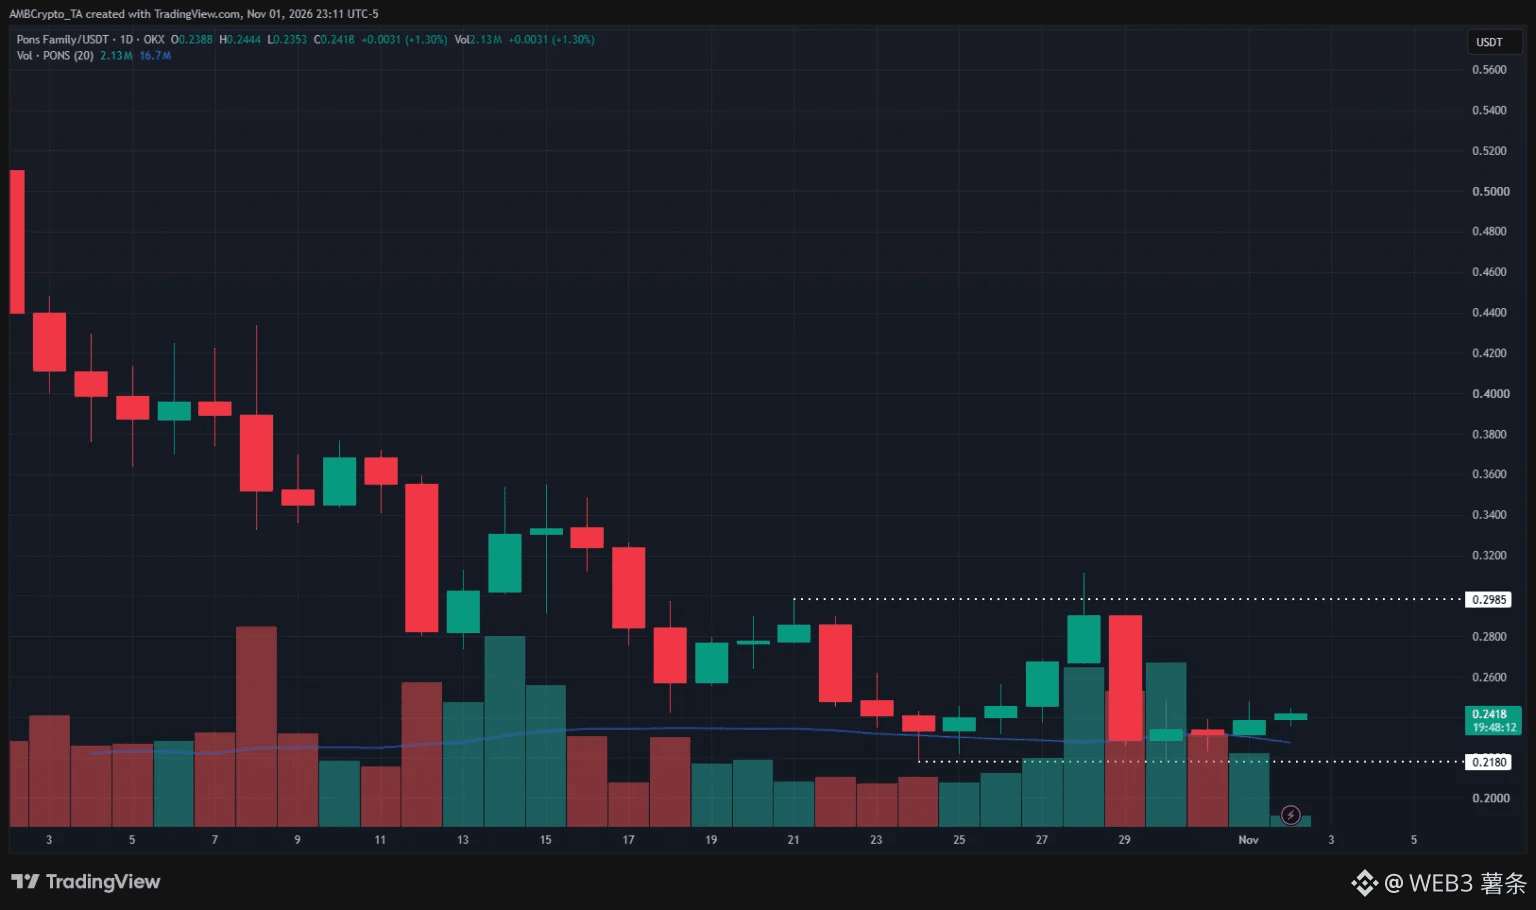
On the daily chart, #pons is currently fluctuating mainly within the $0.218–$0.298 range. These two price levels are important reference points for assessing the recent trend: a daily close below the lower bound could signal that the downtrend is continuing, while a breakout above the upper bound could indicate that the market is starting to strengthen.
Investors can first watch to see whether the price breaks out of this range convincingly before deciding on the next direction. Short-term traders can also monitor support and resistance within the range for potential trading opportunities.
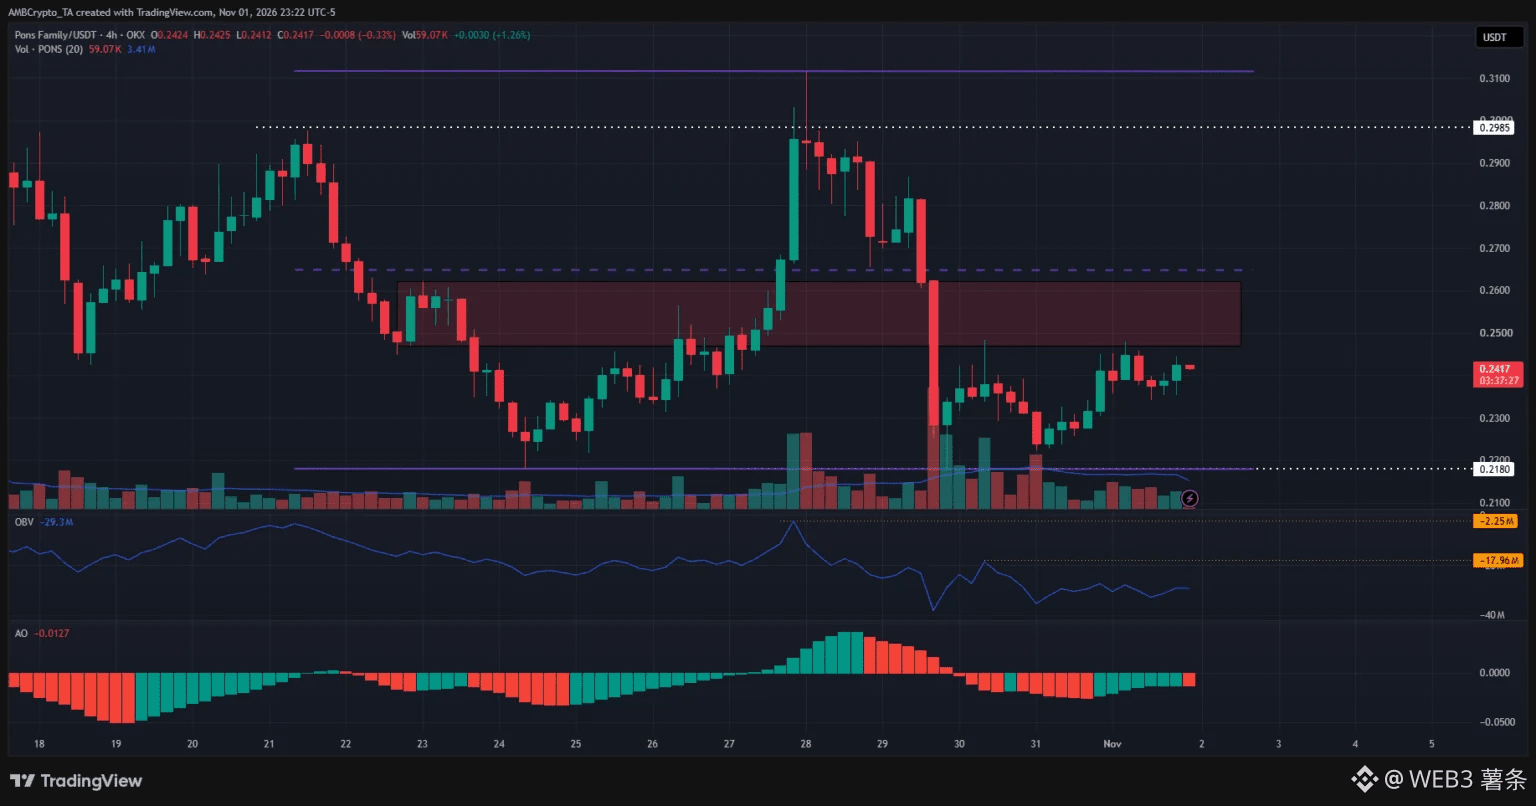
On the 4-hour chart, although PONS has rebounded, buying pressure remains relatively weak. The OBV indicator (used to track the flow of funds through trading volume) has yet to break above its previous high, suggesting that buying activity is still subdued.
In addition, the $0.25–$0.27 area faces notable selling pressure and could act as resistance during the rebound.
On the daily chart, #pons is currently fluctuating mainly within the $0.218–$0.298 range. These two price levels are important reference points for assessing the recent trend: a daily close below the lower bound could signal that the downtrend is continuing, while a breakout above the upper bound could indicate that the market is starting to strengthen.
Investors can first watch to see whether the price breaks out of this range convincingly before deciding on the next direction. Short-term traders can also monitor support and resistance within the range for potential trading opportunities.
On the 4-hour chart, although PONS has rebounded, buying pressure remains relatively weak. The OBV indicator (used to track the flow of funds through trading volume) has yet to break above its previous high, suggesting that buying activity is still subdued.
In addition, the $0.25–$0.27 area faces notable selling pressure and could act as resistance during the rebound.