$XRP $BTC $ETH
Market Overview & Technical Setup
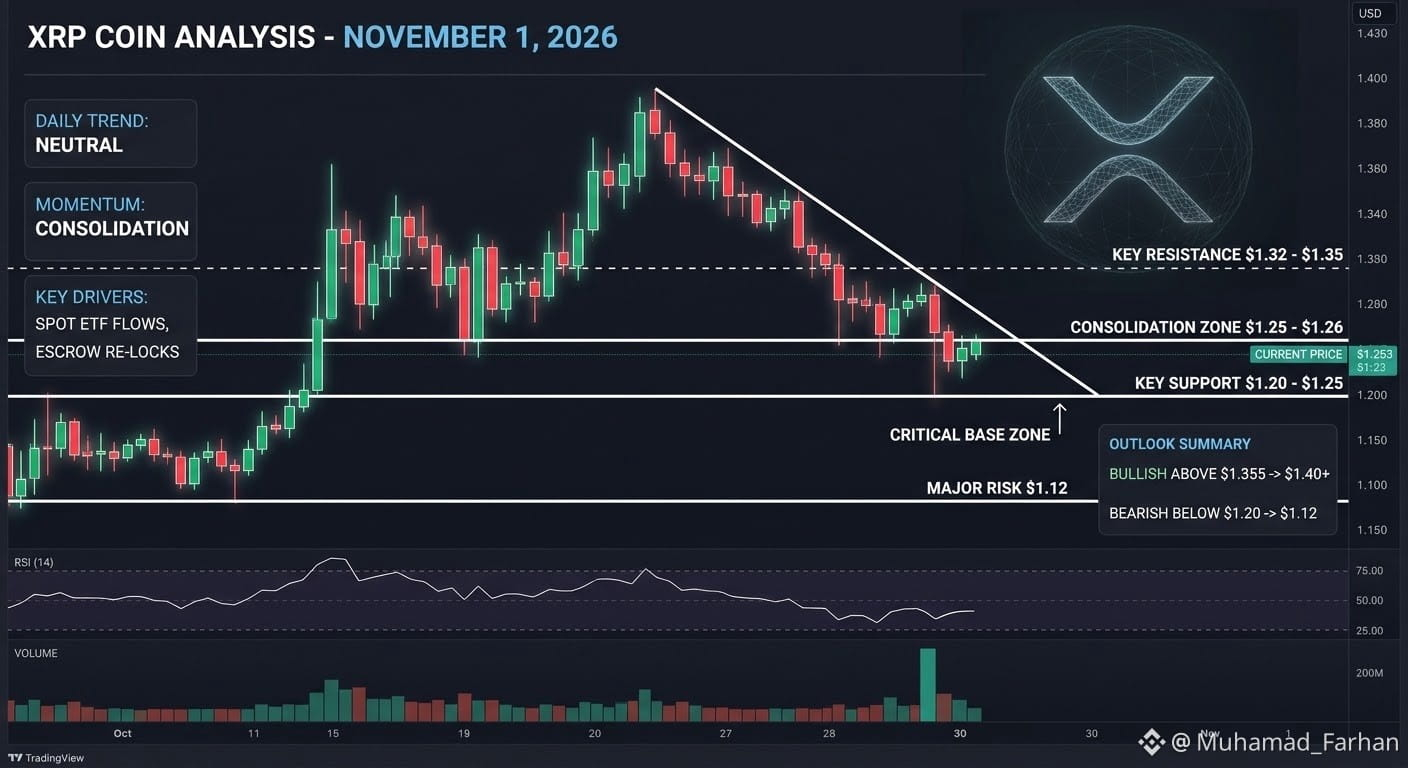
XRP is trading in a tight consolidation zone near $1.25 – $1.26, reflecting a broader pullback across major assets after dropping roughly 18% through October 2026.
Key Resistance: $1.32 – $1.35 (100 SMA / Current Price: $1.25 – $1.26 (Consolidation Key Support: $1.20 – $1.25 (Critical Base Zone) Major Risk: $1.12 (Breakdown Target)
Technical Indicators & Price Levels
Key Support: The $1.25 level acts as immediate short-term support. Below that, $1.20 represents the structural line in the sand; a consistent daily close below $1.20 opens room toward $1.12.
Key Resistance: Short-term resistance sits near $1.325 (38.2%–50% Fib retracements and 4-hour 100 SMA). A breakout past the descending trendline at $1.355 would signal a bullish reversal targeting $1.39–$1.40.
Momentum: Relative Strength Index (RSI) levels hover near neutral (50–52), showing balanced buyer-seller pressure while traders wait for clear directional volume.
Key Fundamental Drivers
Institutional ETF Flows: Demand via spot ETF products has seen muted momentum, with modest weekly inflows keeping upside momentum capped. Re-accelerated institutional inflows will likely be required for a push toward $1.50+.
Escrow Mechanics: Ripple continues its monthly programmatic unlock/lock cycles (~700M XRP re-locked in recent monthly schedules), maintaining a consistent supply balance.
Macro Correlation: XRP is moving in line with top digital assets as traders assess upcoming macroeconomic data and central bank policy decisions.
Bullish vs. Bearish Outlook
TrendTriggerNext Objective📈 Bullish ScenarioClear 4-hour close above $1.355 with rising spot/ETF volumePush toward $1.39 - $1.40📉 Bearish ScenarioBreakdown and daily close below $1.20Retest of liquidity down near $1.12 #BinanceToResumePhaseOneOfWithdrawals #IntelHasItsWorstDaySince1974 #BinanceUpdatesProofofReservesAddresses #CZDismissesClaimsBinanceHackWasPredicted #USSpotETHETFsPost23StraightDaysOfNetOutflows
Market Overview & Technical Setup
XRP is trading in a tight consolidation zone near $1.25 – $1.26, reflecting a broader pullback across major assets after dropping roughly 18% through October 2026.
Key Resistance: $1.32 – $1.35 (100 SMA / Current Price: $1.25 – $1.26 (Consolidation Key Support: $1.20 – $1.25 (Critical Base Zone) Major Risk: $1.12 (Breakdown Target)
Technical Indicators & Price Levels
Key Support: The $1.25 level acts as immediate short-term support. Below that, $1.20 represents the structural line in the sand; a consistent daily close below $1.20 opens room toward $1.12.
Key Resistance: Short-term resistance sits near $1.325 (38.2%–50% Fib retracements and 4-hour 100 SMA). A breakout past the descending trendline at $1.355 would signal a bullish reversal targeting $1.39–$1.40.
Momentum: Relative Strength Index (RSI) levels hover near neutral (50–52), showing balanced buyer-seller pressure while traders wait for clear directional volume.
Key Fundamental Drivers
Institutional ETF Flows: Demand via spot ETF products has seen muted momentum, with modest weekly inflows keeping upside momentum capped. Re-accelerated institutional inflows will likely be required for a push toward $1.50+.
Escrow Mechanics: Ripple continues its monthly programmatic unlock/lock cycles (~700M XRP re-locked in recent monthly schedules), maintaining a consistent supply balance.
Macro Correlation: XRP is moving in line with top digital assets as traders assess upcoming macroeconomic data and central bank policy decisions.
Bullish vs. Bearish Outlook
TrendTriggerNext Objective📈 Bullish ScenarioClear 4-hour close above $1.355 with rising spot/ETF volumePush toward $1.39 - $1.40📉 Bearish ScenarioBreakdown and daily close below $1.20Retest of liquidity down near $1.12 #BinanceToResumePhaseOneOfWithdrawals #IntelHasItsWorstDaySince1974 #BinanceUpdatesProofofReservesAddresses #CZDismissesClaimsBinanceHackWasPredicted #USSpotETHETFsPost23StraightDaysOfNetOutflows