#On-chain Metrics Analysis
BTC: Median Realized Price
The median realized price is the median of the cost basis distribution based on the last time each BTC moved on-chain across the entire network: half of the supply has a higher cost basis, and half has a lower one. Compared with the average cost basis, which can be skewed by large holders, it more closely reflects the break-even level of a “typical holder.”
Current Status · Modest Profit Zone
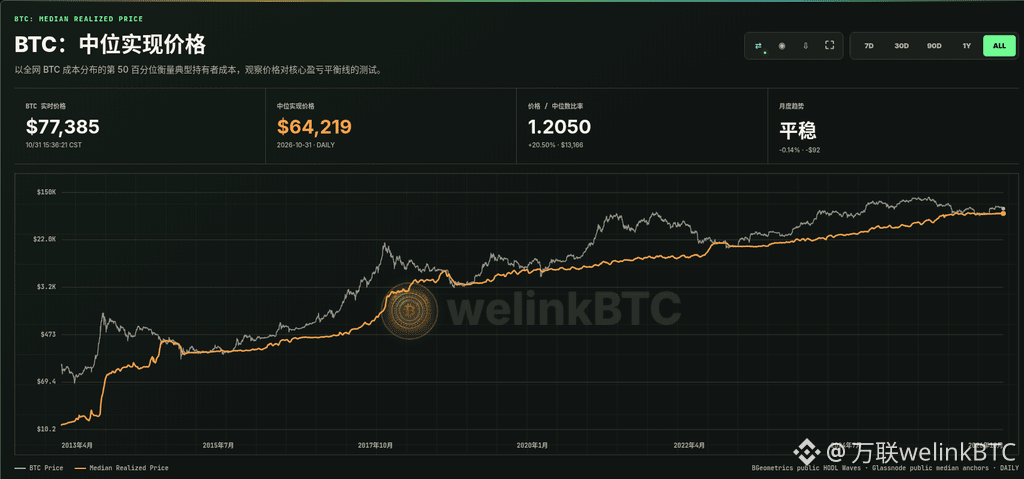
BTC is currently trading at around $77,385, with a median realized price of $64,219 (2026-10-31) and a price-to-median ratio of 1.2050. The current price is about 20.50% (approximately $13,166) above the median, so typical holders remain broadly in profit. The monthly trend is steady (-0.14%, approximately -$92). This cost basis was $44,936 a year ago (up 42.9% year over year) and $19,384 four years ago (up 231.3% over four years), showing that the cost basis of core holders continues to rise.
Historical context: When the current price nears the median realized price, the market is testing the break-even level of core participants, which often acts as significant support or resistance. Being slightly above this level indicates modest overall profits, but does not mean a bottom has been confirmed. Watch whether the price can stabilize above the median cost basis, and look for confirmation from trading volume, short-term holder cost basis, and liquidity. If the price falls below this level and fails to recover quickly, it may turn into resistance. For cycle research only; this is not investment advice.
【BTC Short-Term Snapshot】
BTCUSDT is trading at around 77,540 USDT on Binance, nearly flat over 24 hours (about +0.05%), and consolidating within an intraday range of approximately 76,326–78,110.
Macro: The Fed kept rates unchanged at 3.75%–4% at its 10/28 meeting (10–2 vote, with two members favoring a hike). In the short term, prices remain sensitive to the “pause, but hawkish” outlook.
Flows: U.S. spot BTC ETFs saw net outflows of approximately $643 million on 10/30 (Farside), their largest single-day redemption since June. Weekly flows and the October total also turned negative.
Short-term outlook: Price is consolidating above approximately 76,000. Resistance is around 78,000–81,000, while support near the intraday low is worth watching. For discussion only; this is not investment advice.
More Selected On-Chain Cycle Indicators
Portal
https://welinkbtc-onchainmain.xyz/
Understand market cycles like a professional analyst
$BTC
BTC: Median Realized Price
The median realized price is the median of the cost basis distribution based on the last time each BTC moved on-chain across the entire network: half of the supply has a higher cost basis, and half has a lower one. Compared with the average cost basis, which can be skewed by large holders, it more closely reflects the break-even level of a “typical holder.”
Current Status · Modest Profit Zone
BTC is currently trading at around $77,385, with a median realized price of $64,219 (2026-10-31) and a price-to-median ratio of 1.2050. The current price is about 20.50% (approximately $13,166) above the median, so typical holders remain broadly in profit. The monthly trend is steady (-0.14%, approximately -$92). This cost basis was $44,936 a year ago (up 42.9% year over year) and $19,384 four years ago (up 231.3% over four years), showing that the cost basis of core holders continues to rise.
Historical context: When the current price nears the median realized price, the market is testing the break-even level of core participants, which often acts as significant support or resistance. Being slightly above this level indicates modest overall profits, but does not mean a bottom has been confirmed. Watch whether the price can stabilize above the median cost basis, and look for confirmation from trading volume, short-term holder cost basis, and liquidity. If the price falls below this level and fails to recover quickly, it may turn into resistance. For cycle research only; this is not investment advice.
【BTC Short-Term Snapshot】
BTCUSDT is trading at around 77,540 USDT on Binance, nearly flat over 24 hours (about +0.05%), and consolidating within an intraday range of approximately 76,326–78,110.
Macro: The Fed kept rates unchanged at 3.75%–4% at its 10/28 meeting (10–2 vote, with two members favoring a hike). In the short term, prices remain sensitive to the “pause, but hawkish” outlook.
Flows: U.S. spot BTC ETFs saw net outflows of approximately $643 million on 10/30 (Farside), their largest single-day redemption since June. Weekly flows and the October total also turned negative.
Short-term outlook: Price is consolidating above approximately 76,000. Resistance is around 78,000–81,000, while support near the intraday low is worth watching. For discussion only; this is not investment advice.
More Selected On-Chain Cycle Indicators
Portal
https://welinkbtc-onchainmain.xyz/
Understand market cycles like a professional analyst
$BTC