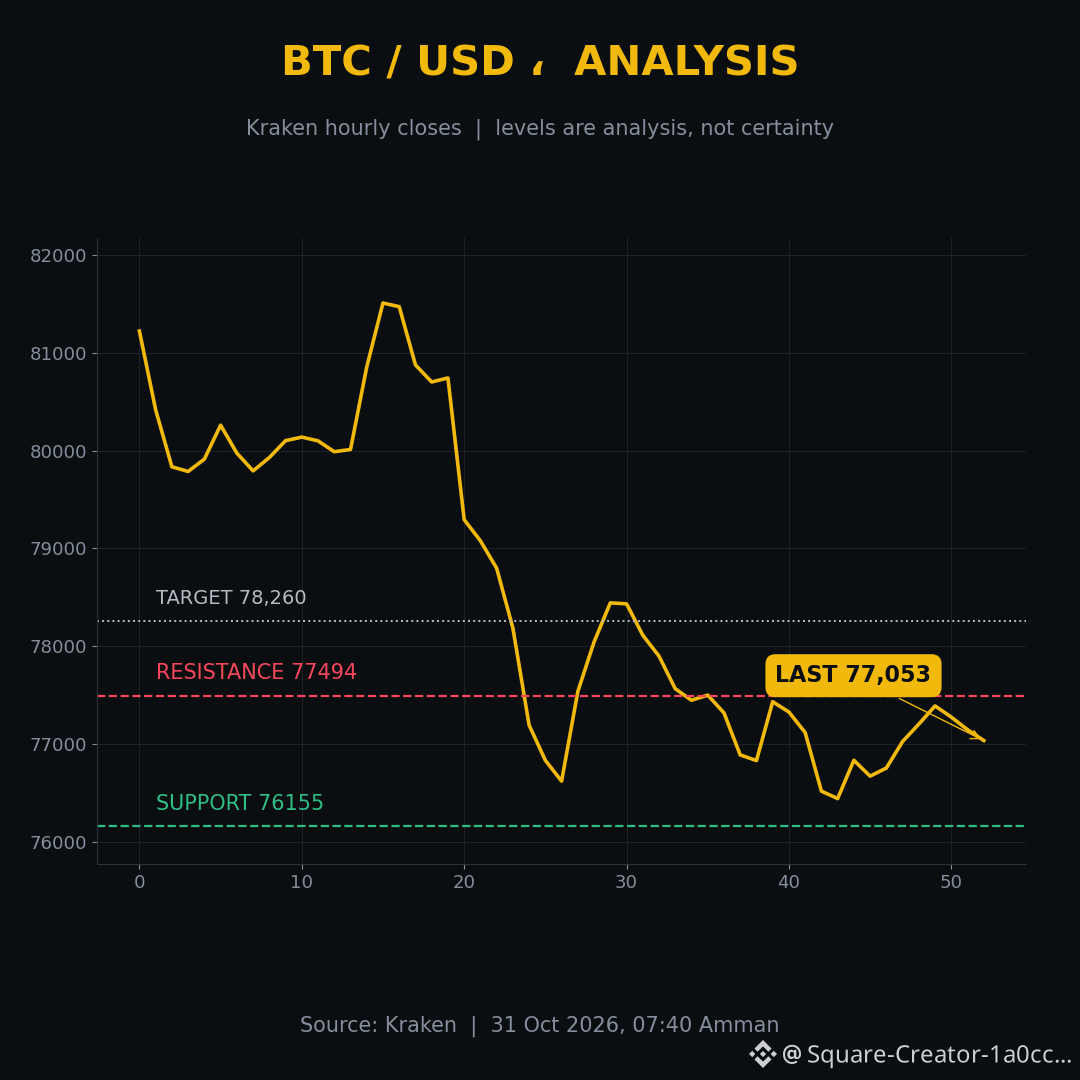
📉 Bitcoin Analysis: $77,494 is the ceiling that needs to break—and below it, the market is trapped
$BTC This is an analysis of price levels—not a recommendation to buy or sell. Prices are from Kraken on the morning of October 31, and the analysis is based on them.
(1) Price structure:
• Daily trend: bearish after breaking below $80,000; 4-hour trend: sideways after the drop
• Latest price is around $77,053, with a 24-hour range of $76,155–$77,494
• Over 48 hours: from around $81,287 to $77,034—about a 5% drop, and the rebound from Friday evening’s low is still fragile
(2) Levels:
• Support: $76,155 (Friday evening’s low), then around $75,000
• Resistance: $77,494 (24-hour high), then $78,260, then $80,000
• The level that will decide the day: $77,494—holding above it opens the way to $78,260; rejection there keeps the market range-bound
• Invalidation level: a daily close below $76,155 invalidates the bottom-and-rebound thesis
(3) Derivatives:
• October 30 liquidations totaled around $1.55 billion, including about $1.34 billion in long positions (Coinglass)—Bitcoin alone accounted for around $468 million
• Funding rates and open interest changes could not be verified from a direct source at the time of writing, so we won’t cite figures for them
(4) Flows:
• U.S. spot Bitcoin ETFs saw $17.07 million in inflows on Thursday, October 29 (SoSoValue)—the fourth consecutive day of inflows, but a clear slowdown: $110 million, then $176 million, then $137 million, then $17 million over the week
• Ethereum ETFs saw $105.48 million in outflows on the same day—the fourth consecutive day of outflows
• Bitcoin dominance is 59.2%—the whole market fell together, with no clear flight to an alternative
(5) Scenario tree:
• Breakout scenario: close above $77,494 → target the $78,260 area, then $80,000; invalidated by a daily close below $76,155
• Further downside scenario: break below $76,155 on a closing basis → target the $75,000 area, then $73,000; invalidated by a move back above $77,494
What does all this mean?
The market isn’t crashing or rebounding—it’s waiting for confirmation: Sunday’s outflows and Monday’s proof of reserves will determine whether the bottom really was the bottom.
Quick question: Do you think $77,494 will break this week, or will the price be rejected? Write “breaks” or “rejects.”
Source: Kraken, Coinglass, SoSoValue — October 31, 2026
#البيتكوين #Analysis