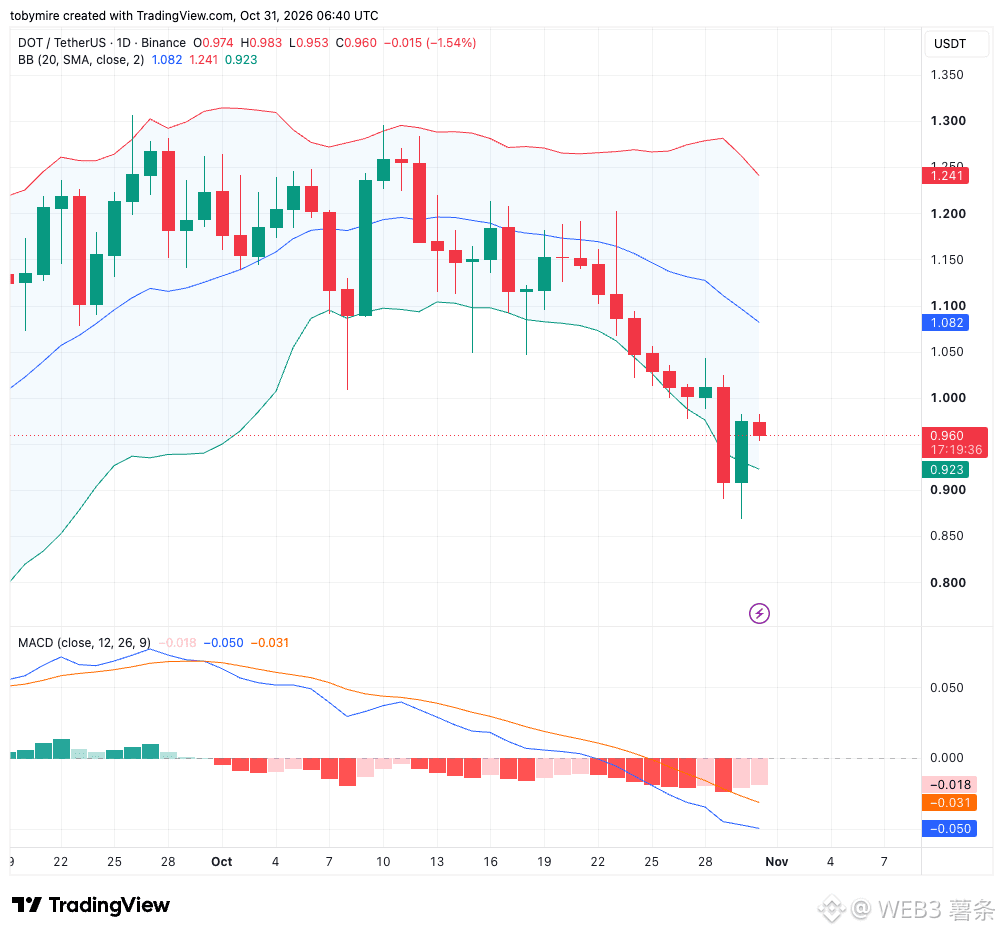
#dot Price Trend Analysis
As of October 31, $DOT was hovering around $0.960, rebounding from a low of $0.87. However, it encountered resistance near $1 and failed to break through.
Technical indicators show that DOT remains below the Bollinger Band middle line at $1.082, suggesting the overall trend is still relatively weak. Although the MACD remains in negative territory, downward momentum has eased, indicating that short-term selling pressure may be subsiding. However, there is not yet enough evidence to confirm a trend reversal.
Key support and resistance levels:
Support: $0.923 is the first support level. If it breaks, the price could fall further to $0.90, or even retest the $0.87 low.
Resistance: The first area to watch is $0.983–$1.00. Only a successful breakout could open the way for a further test of $1.082.
Overall, although DOT has rebounded somewhat, it has not yet escaped its weak trend. In the short term, watch whether it can hold above $0.923 and reclaim $1. Avoid blindly chasing the price higher.