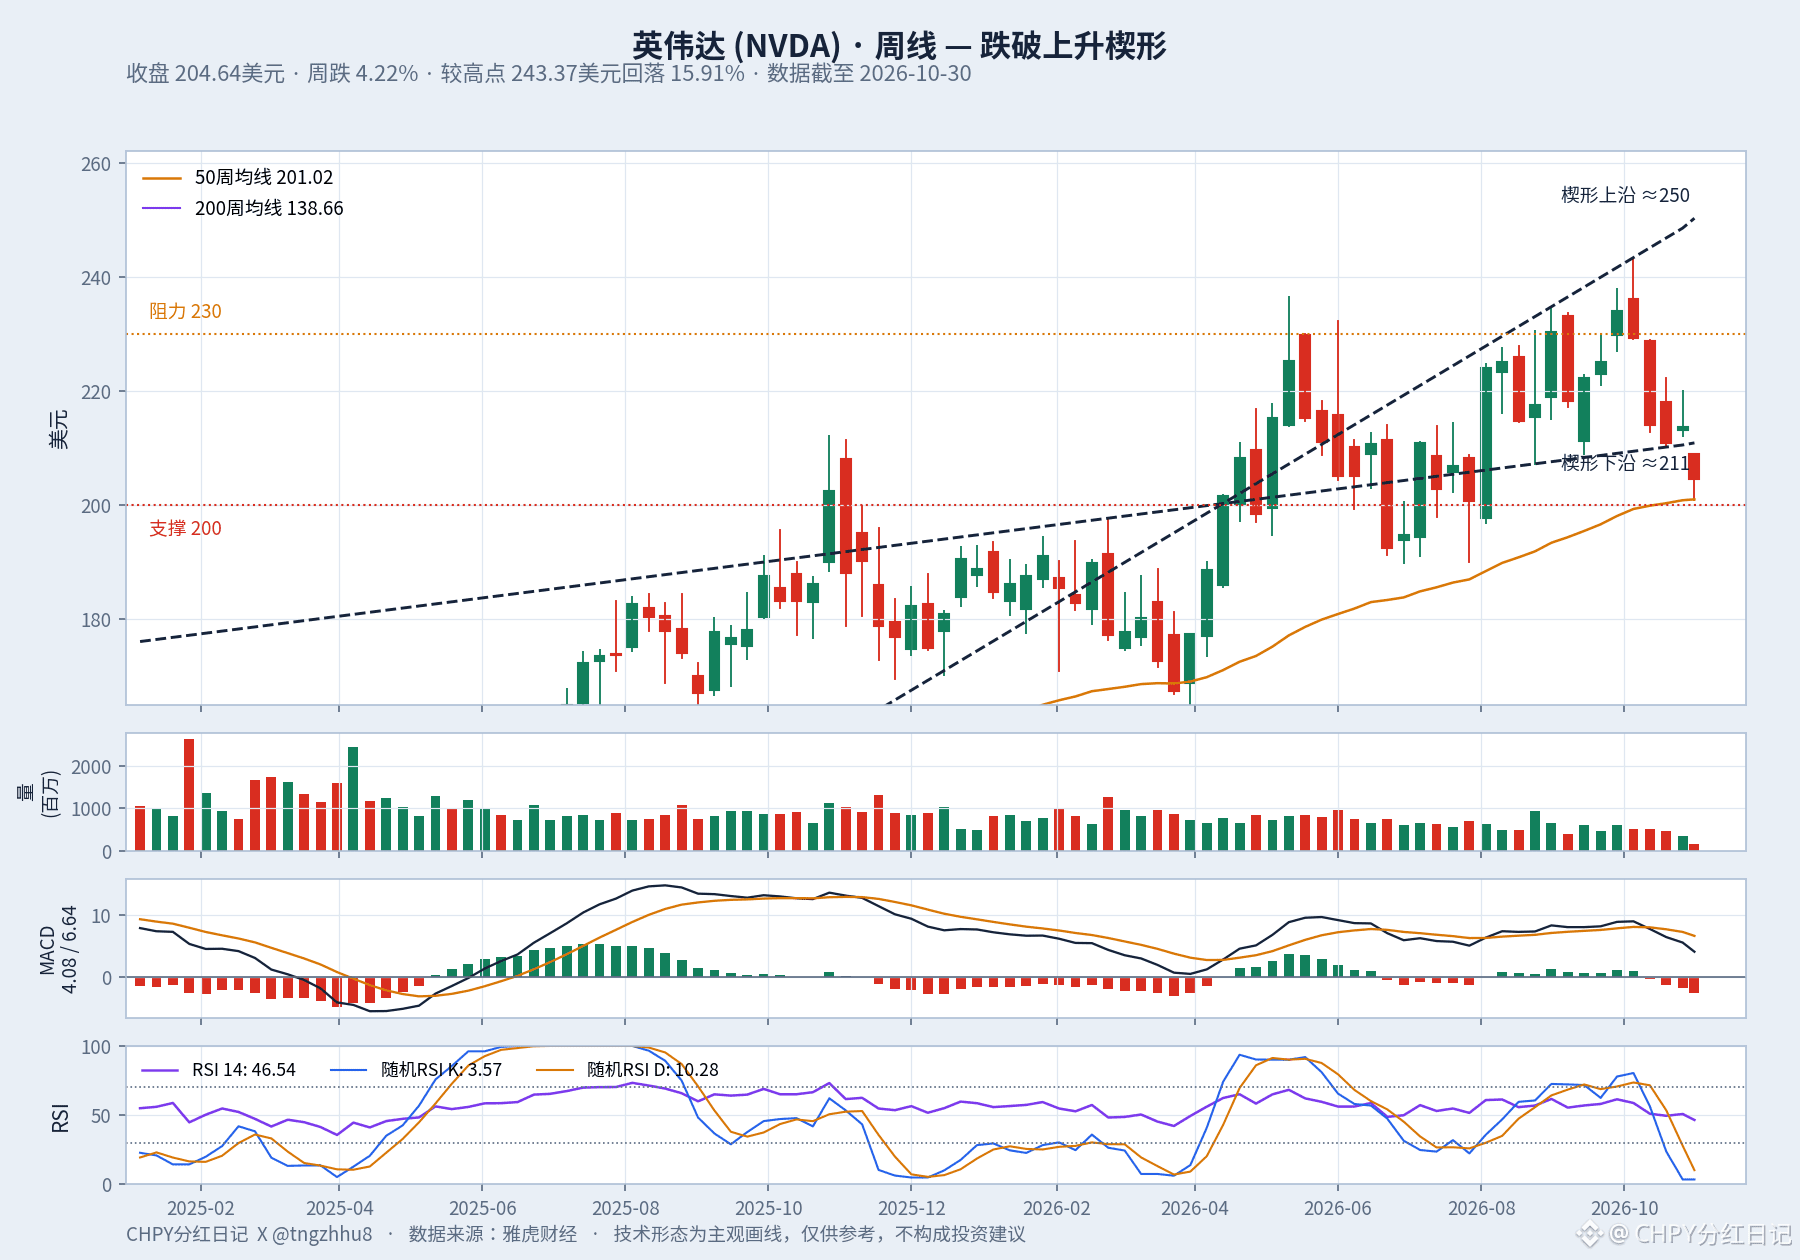
Nvidia’s weekly chart has broken below its rising wedge.
Nvidia closed this week at $204.64, down 4.22% for the week and 15.91% from its high of $243.37. It hit an intraday low of $200.92, having already tested the $200 level once. The weekly chart tells a clear story: from late August to early October, the stock kept rising within an increasingly narrow range between $234 and $243, as the upper and lower trendlines converged into a wedge. Put simply, a rising wedge is a pattern in which gains become increasingly difficult to sustain; textbooks generally consider it bearish. The wedge’s lower boundary is now around $211, and this week’s close fell $6 below it. This wasn’t a brief dip below the line—the closing price finished beneath it.
The indicators confirm the move: MACD (a trend-strength indicator) has just made a bearish cross, and its histogram has turned negative. The stochastic RSI (an indicator of short-term overbought and oversold conditions) has fallen to 3.57 for %K and 10.28 for %D, both in single digits, suggesting the stock is oversold in the short term. But the 14-day RSI is still at 46.54, not yet in the oversold zone below 30. In other words, momentum has genuinely weakened, but the stock hasn’t reached the extreme levels associated with panic selling. That’s where the disagreement lies.
Looking lower, $211 is the first hurdle: if the price breaks below it and cannot reclaim it on a retest, $211 will turn from support into resistance. If that level doesn’t hold, the next one is the $200 mark, which coincides with the 50-week moving average at $201. Below that is the consolidation zone from late June to early July, with lows around $190. To the upside, the first level to watch on a rebound is $230—the early-September base and previous high are both around there. If the stock can’t break through, it would form a lower high, and the decline could resume after the rebound. Only a move back above $211 would make this breakdown a false breakout.
A few risks are worth noting upfront: wedges are drawn patterns, and different people may place the trendlines several dollars apart—they aren’t exact measurements. Earnings and macroeconomic news can change the technical picture at any time. This article discusses technical analysis only and is not investment advice.
#英伟达 #USStocks
Nvidia closed this week at $204.64, down 4.22% for the week and 15.91% from its high of $243.37. It hit an intraday low of $200.92, having already tested the $200 level once. The weekly chart tells a clear story: from late August to early October, the stock kept rising within an increasingly narrow range between $234 and $243, as the upper and lower trendlines converged into a wedge. Put simply, a rising wedge is a pattern in which gains become increasingly difficult to sustain; textbooks generally consider it bearish. The wedge’s lower boundary is now around $211, and this week’s close fell $6 below it. This wasn’t a brief dip below the line—the closing price finished beneath it.
The indicators confirm the move: MACD (a trend-strength indicator) has just made a bearish cross, and its histogram has turned negative. The stochastic RSI (an indicator of short-term overbought and oversold conditions) has fallen to 3.57 for %K and 10.28 for %D, both in single digits, suggesting the stock is oversold in the short term. But the 14-day RSI is still at 46.54, not yet in the oversold zone below 30. In other words, momentum has genuinely weakened, but the stock hasn’t reached the extreme levels associated with panic selling. That’s where the disagreement lies.
Looking lower, $211 is the first hurdle: if the price breaks below it and cannot reclaim it on a retest, $211 will turn from support into resistance. If that level doesn’t hold, the next one is the $200 mark, which coincides with the 50-week moving average at $201. Below that is the consolidation zone from late June to early July, with lows around $190. To the upside, the first level to watch on a rebound is $230—the early-September base and previous high are both around there. If the stock can’t break through, it would form a lower high, and the decline could resume after the rebound. Only a move back above $211 would make this breakdown a false breakout.
A few risks are worth noting upfront: wedges are drawn patterns, and different people may place the trendlines several dollars apart—they aren’t exact measurements. Earnings and macroeconomic news can change the technical picture at any time. This article discusses technical analysis only and is not investment advice.
#英伟达 #USStocks