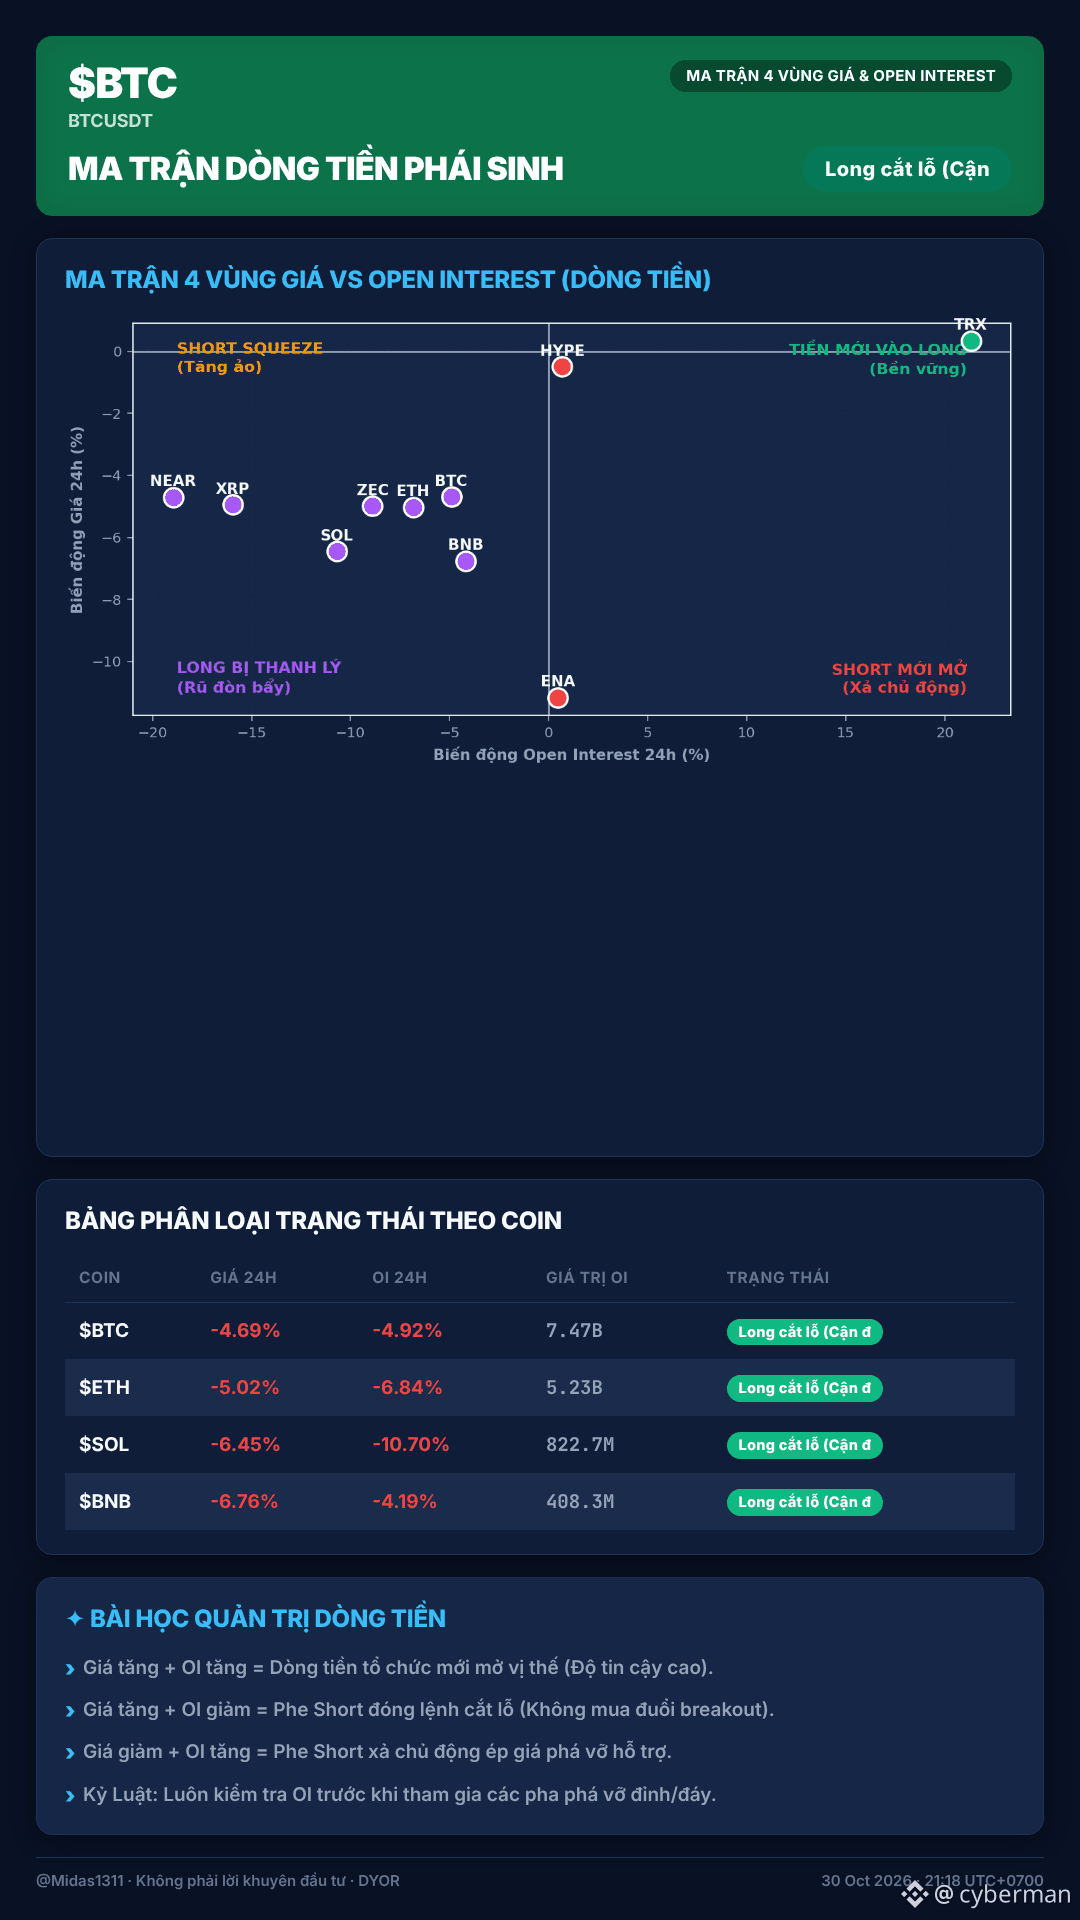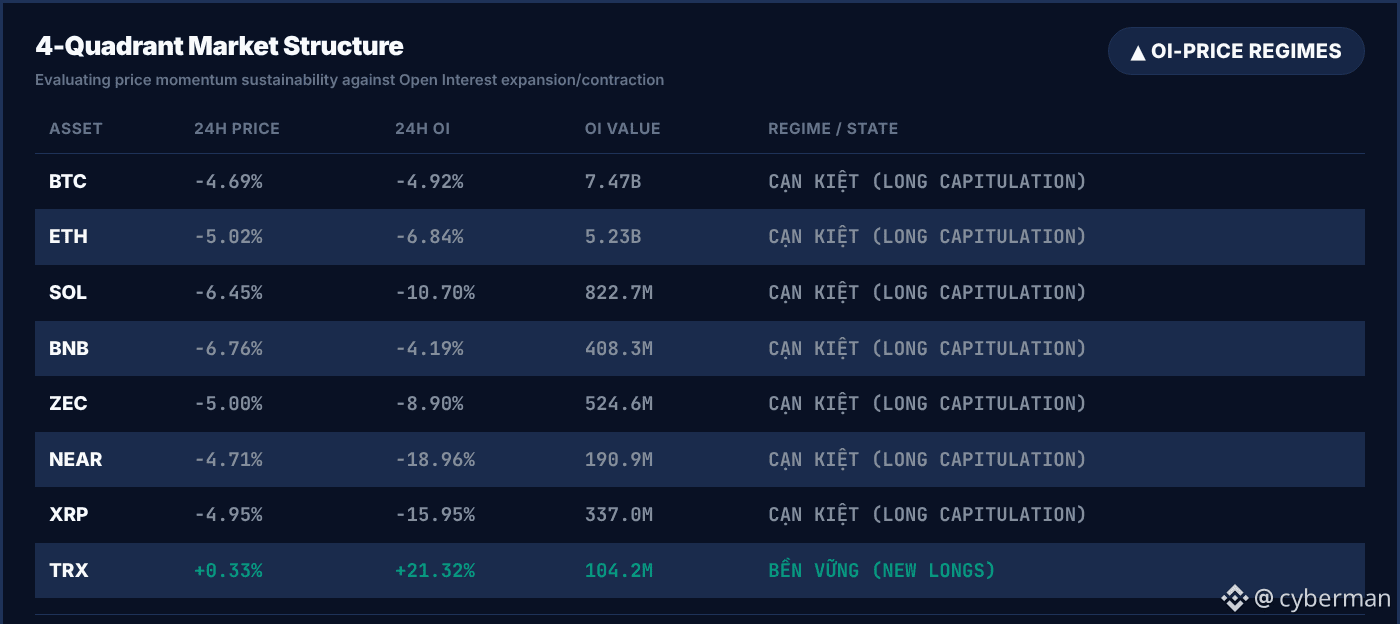
Many people look at the candlestick chart for $BTC and the altcoins and think that a sea of red can only mean prices are falling. But a closer look at the 24H Price & OI matrix reveals what’s really going on. 🤓
In reality, most of the market is in the Long Liquidation / Exhaustion zone. $BTC is down 4.69%, and OI has dropped 4.92%. Solana is even weaker, down 6.45% in price and 10.70% in OI. NEAR is brutal: its price is down 4.71%, but OI has plunged by a whopping 18.96%, showing just how intense the liquidations have been. 🧮 These are all signs of “capitulation,” with a fairly clear bottom forming. 😐 TRX, on the other hand, is in the Price ↑ + OI ↑ zone, with its price up 0.33% and OI surging 21.32%—evidence of sustainable new money flowing in. 📐
The lesson: don’t chase coins that are rising while OI is falling; that’s often a liquidation trap. OI confirmation is what matters. 😏
With $BTC and this bunch of altcoins looking “exhausted,” who still has cash on hand to watch for a chance to catch the bottom?
#Write2Earn #TechnicalAnalysis #BinanceFutures
(NFA — just sharing my personal take)
---