

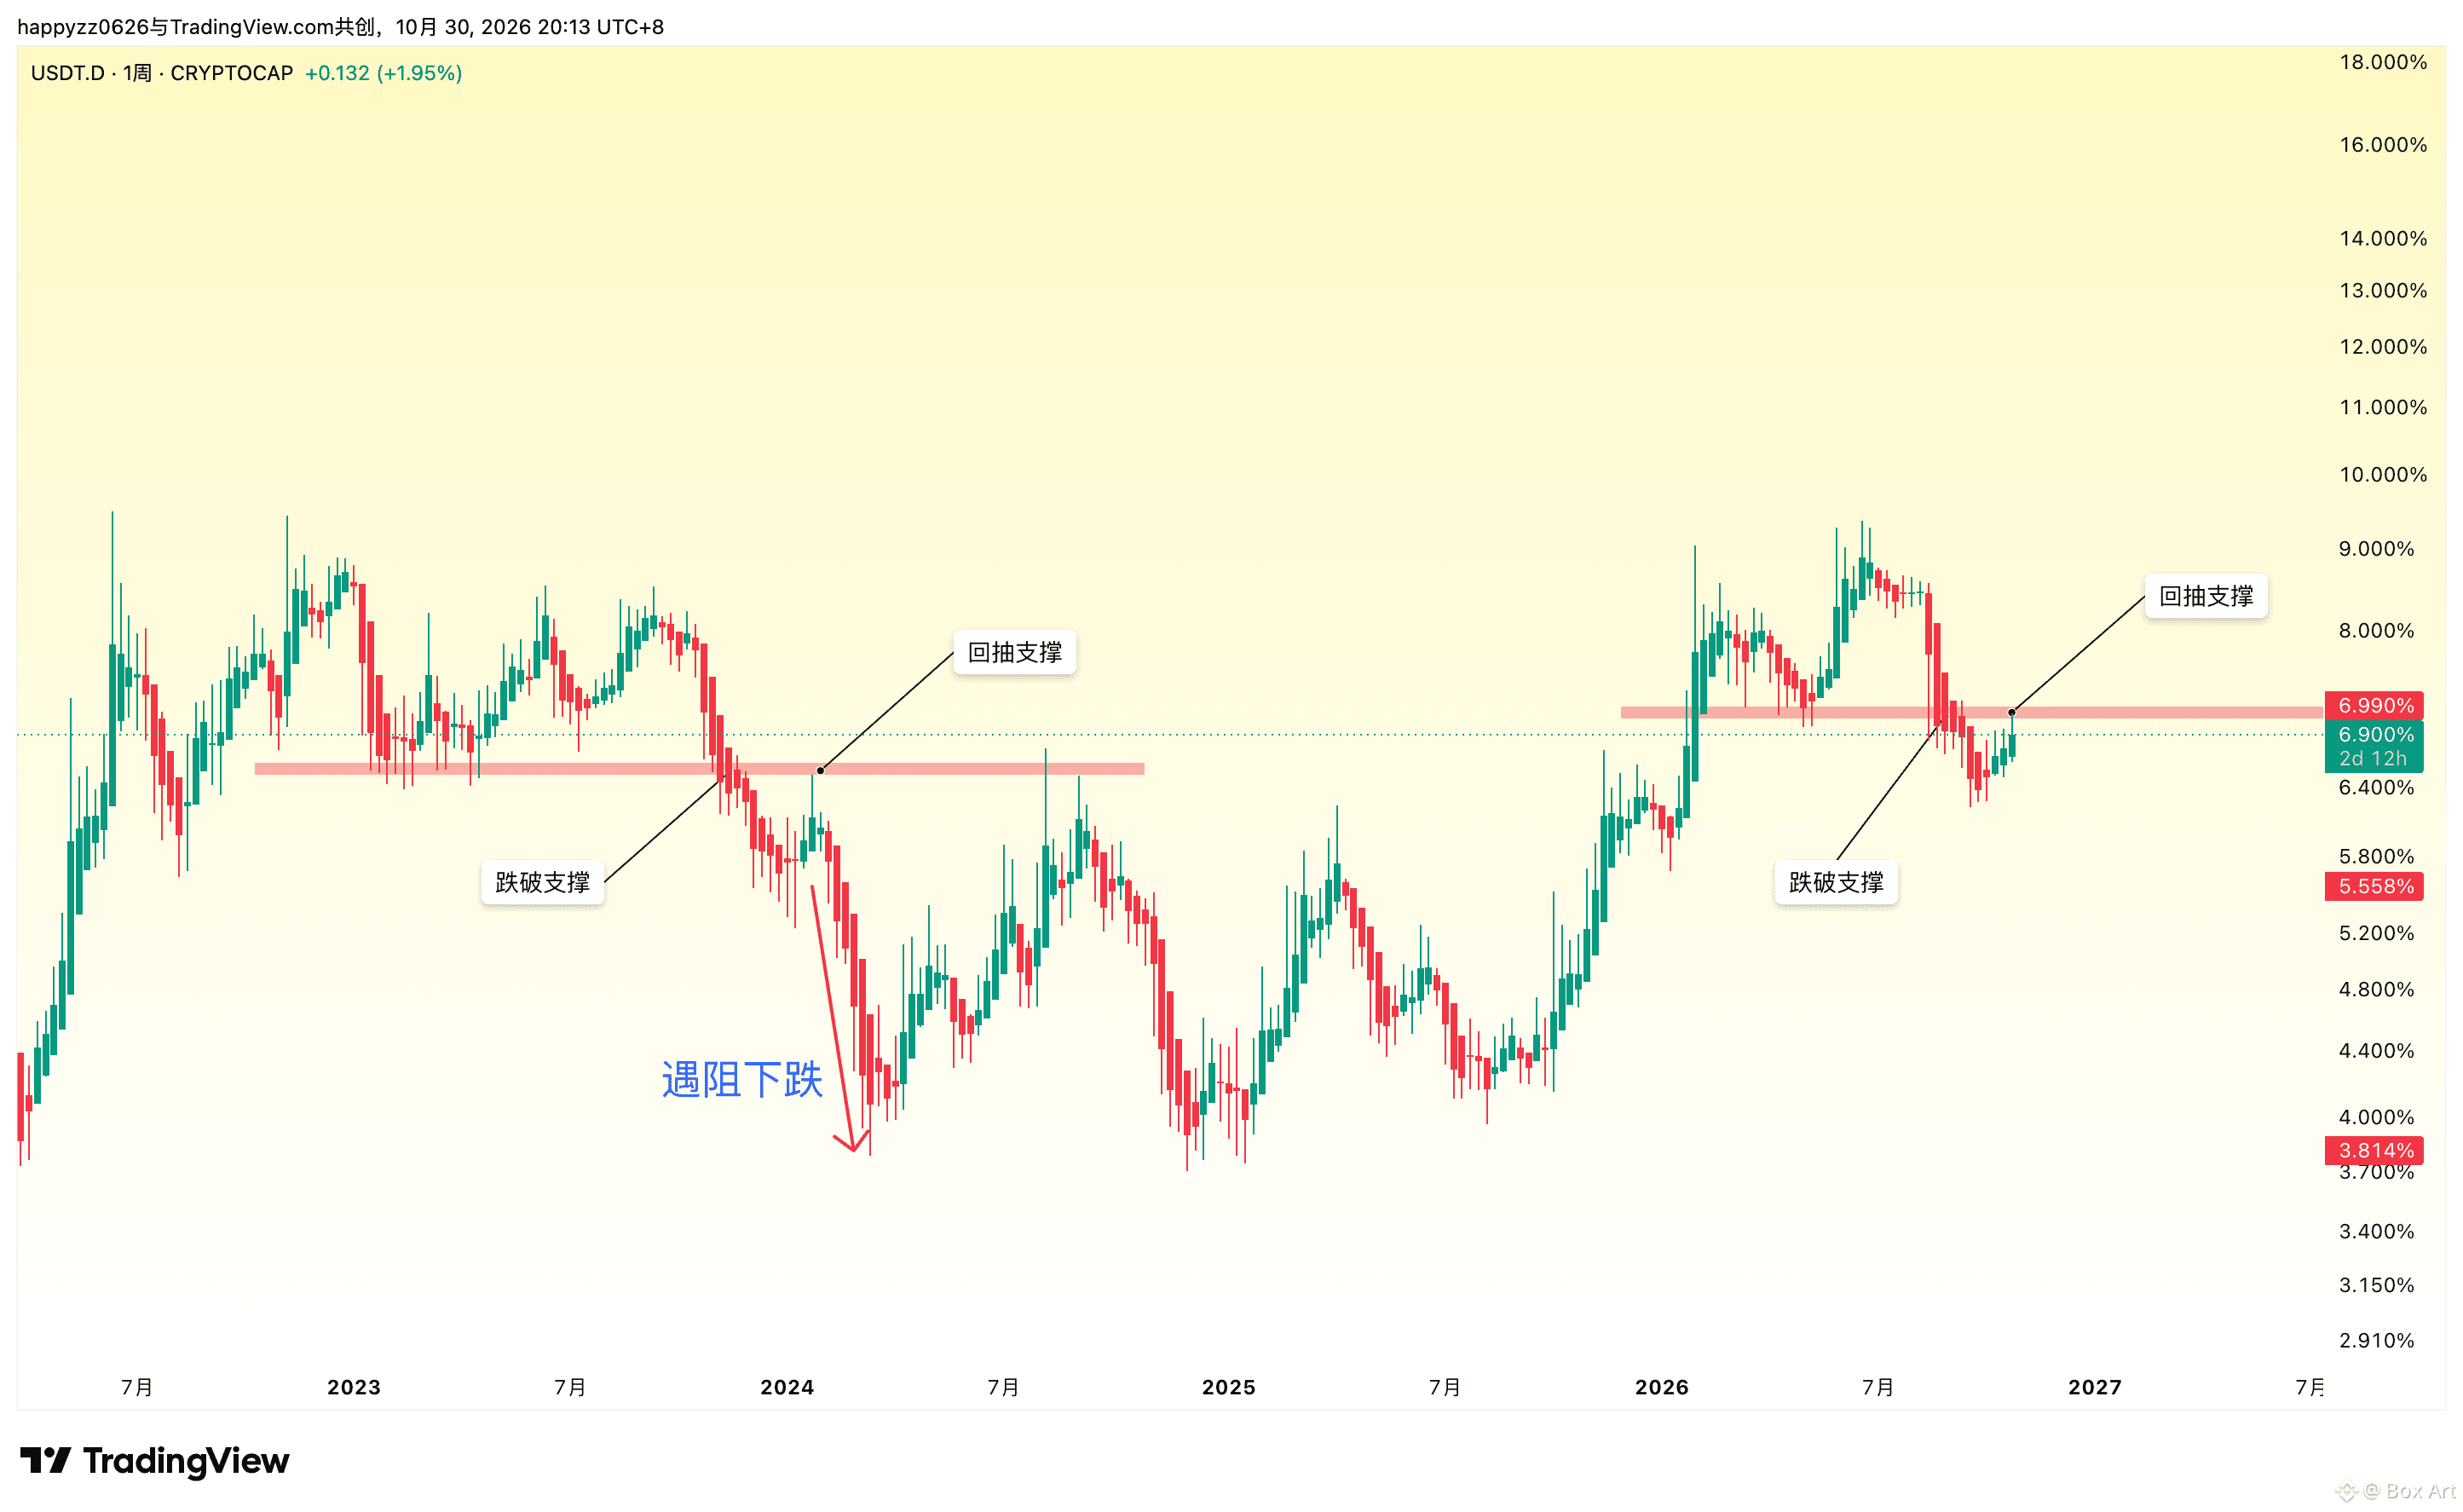
$BTC USDT.D weekly chart: My personal assessment is that this is a weekly-level breakdown followed by a retest. Watch how price reacts to resistance in the red zone; if it fails to break through decisively, a waterfall decline may begin. USDT.D can be viewed as an inverse chart of BTC.

Join global crypto users on Binance Square
⚡️ Get latest and useful information about crypto.
💬 Trusted by the world’s largest crypto exchange.
👍 Discover real insights from verified creators.
Email / Phone number