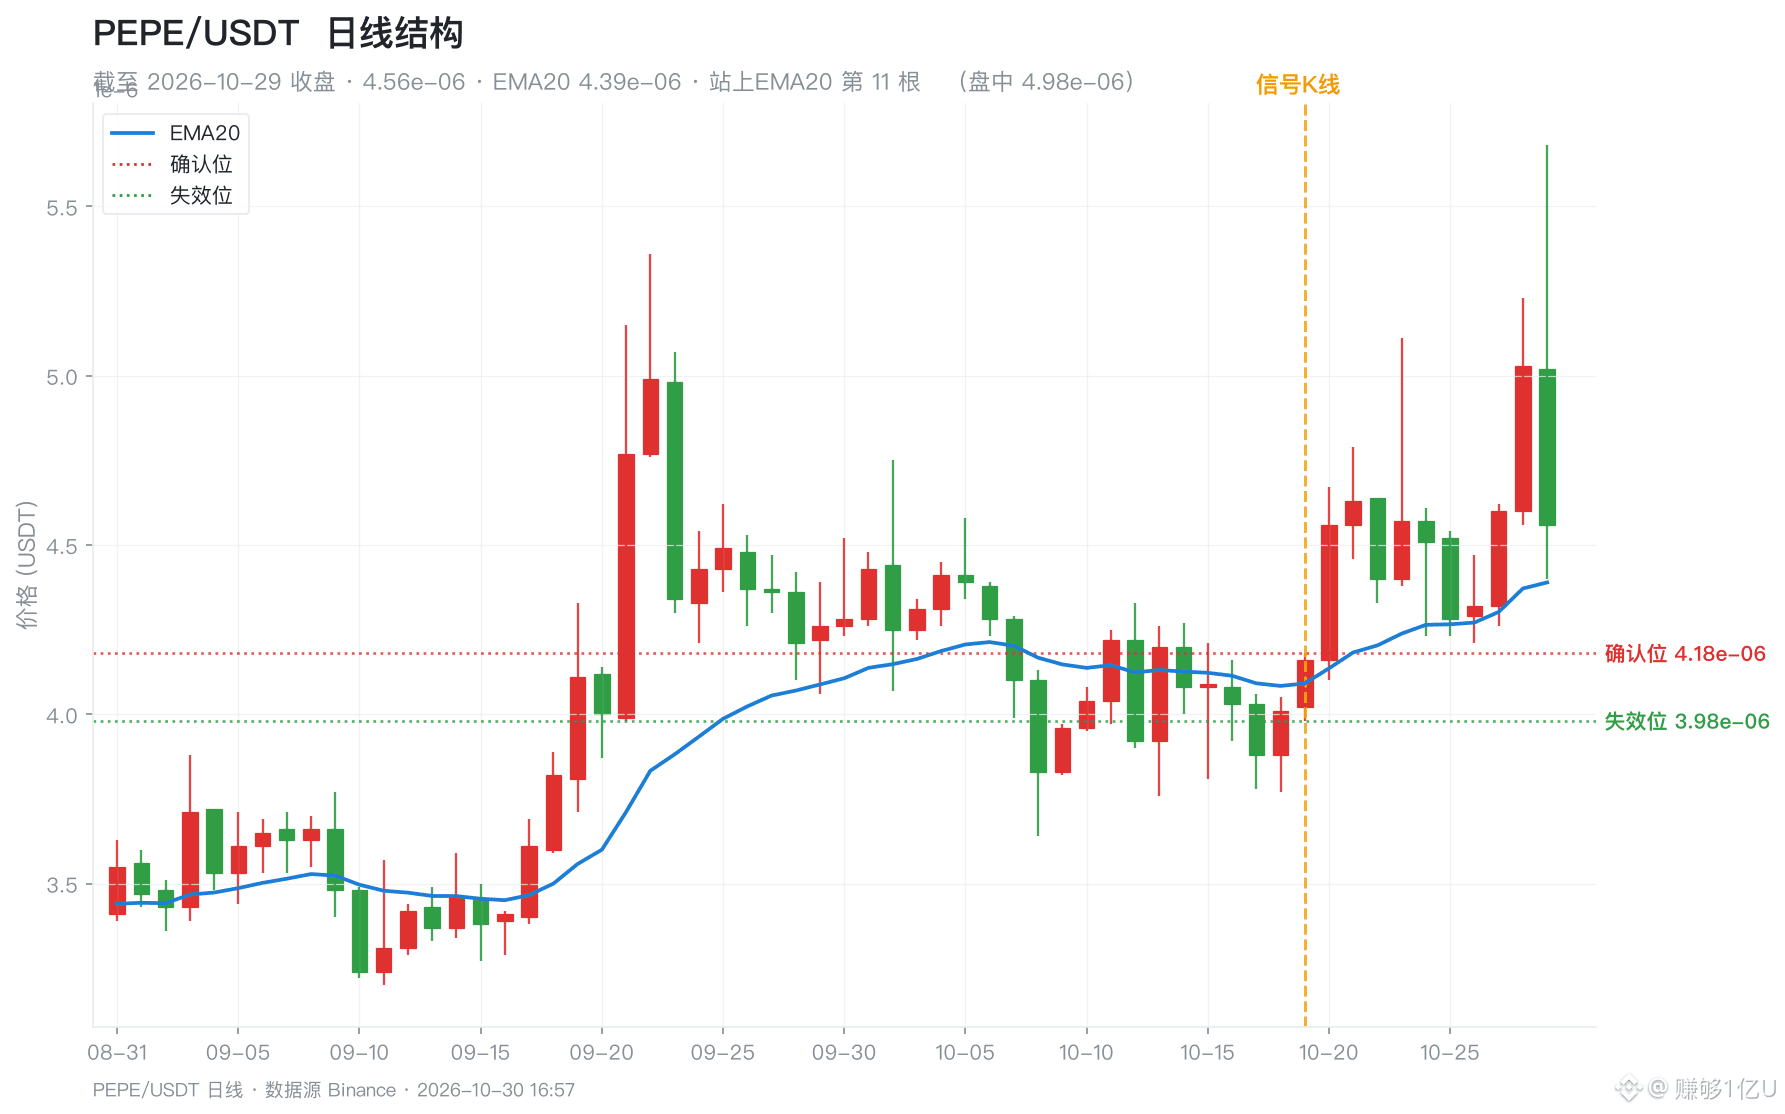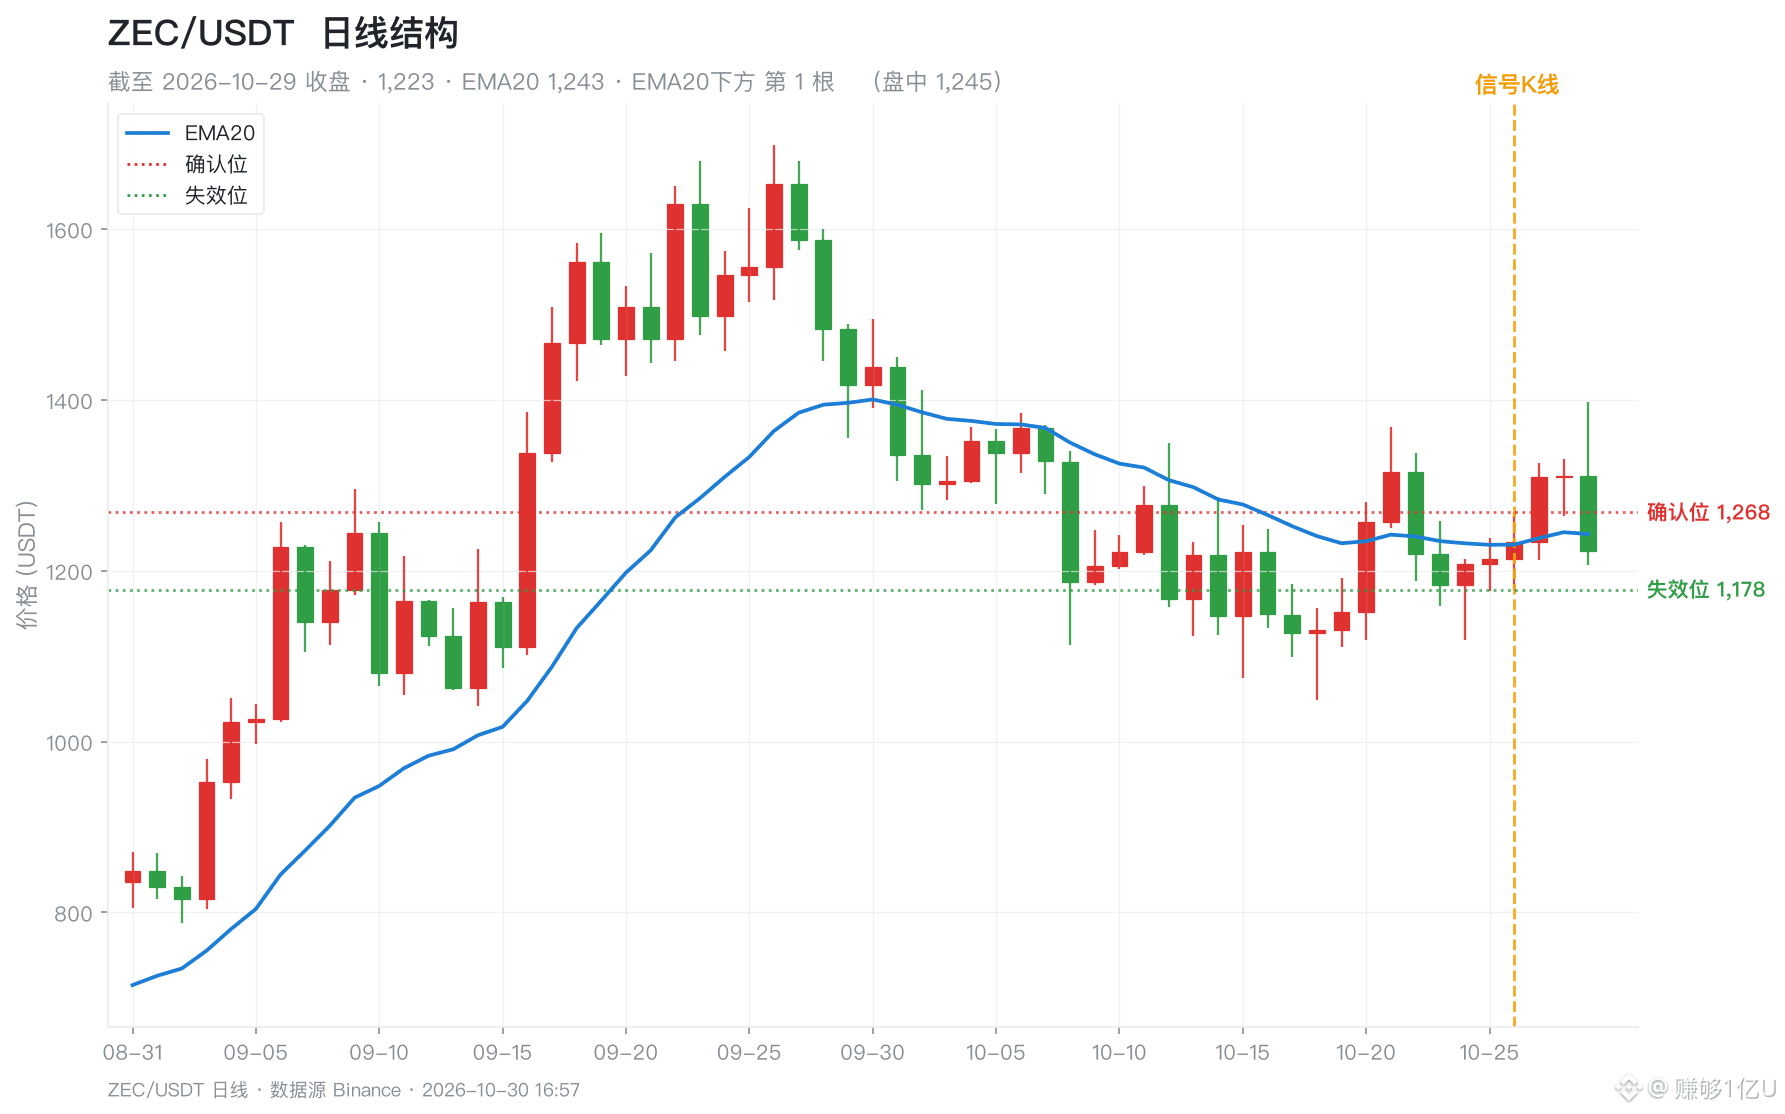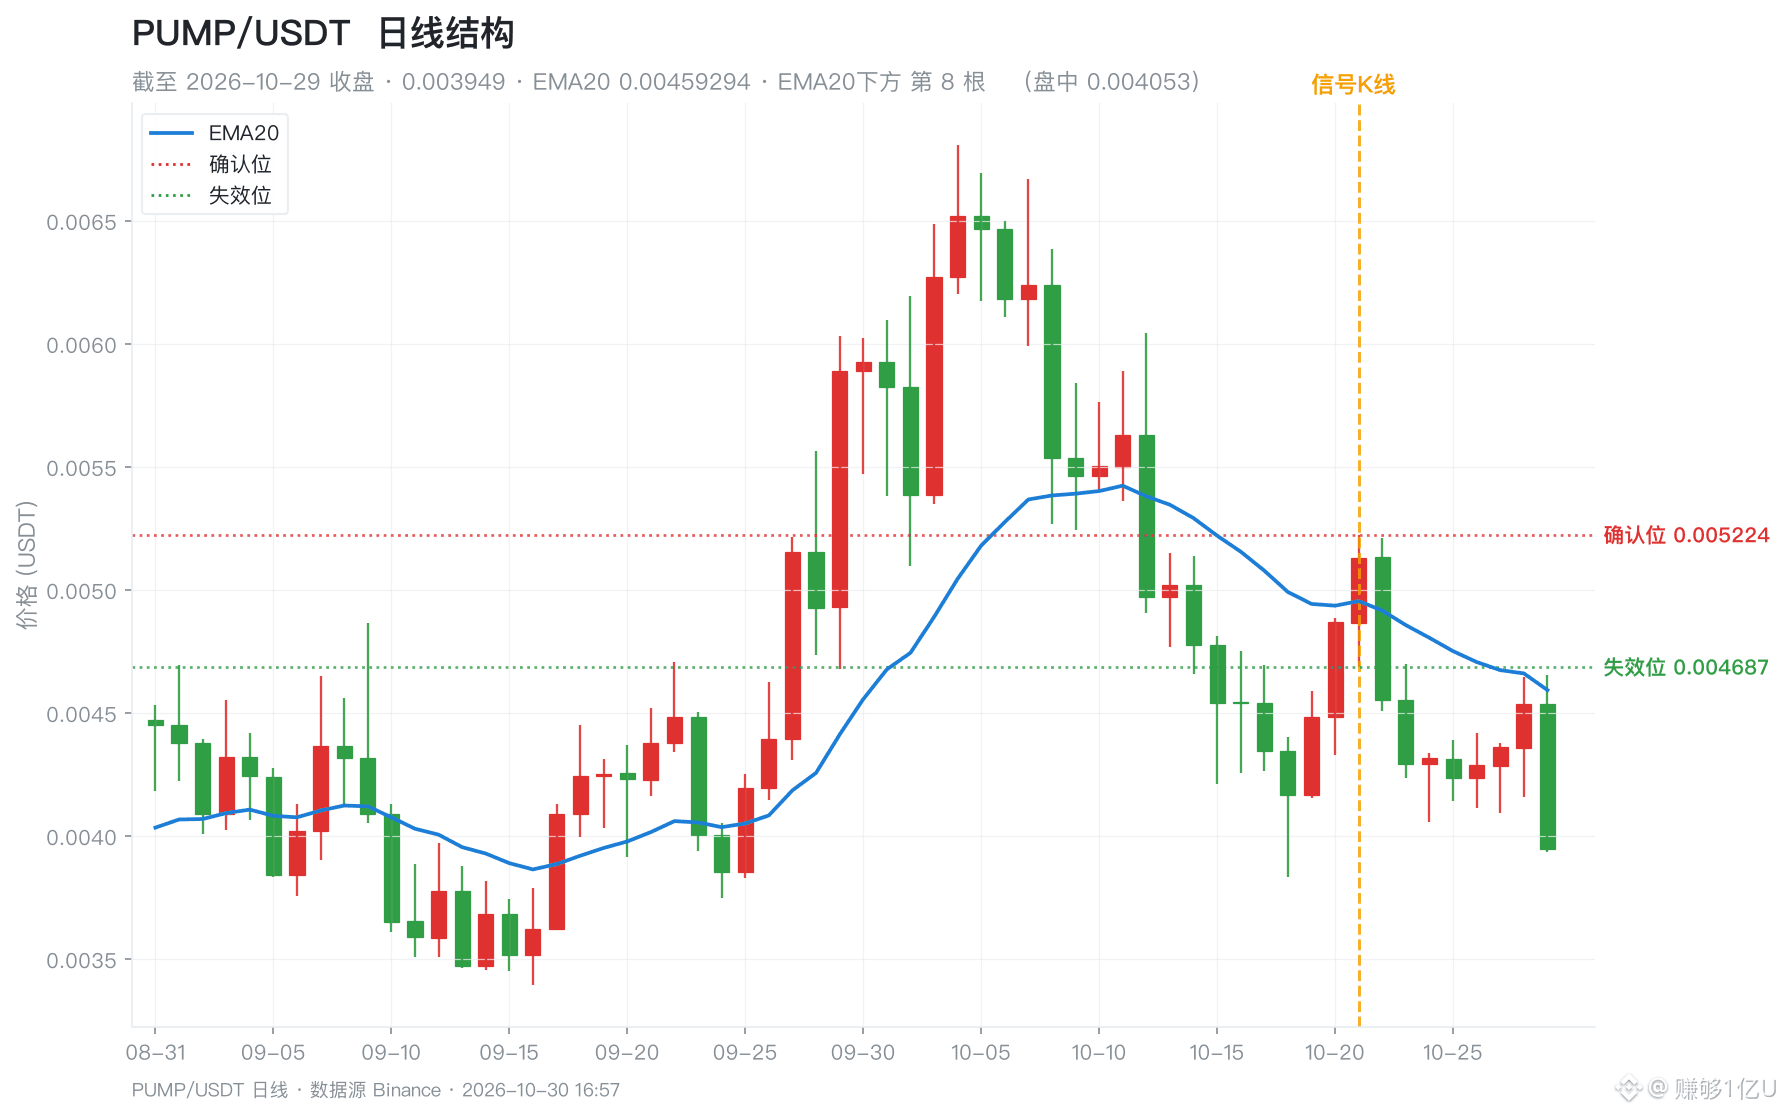
Today's EMA20 structure scan (daily chart, data through the 10-29 close). After several days of playing out, the same batch of breakout signals has now split into three distinct tiers.
1) PEPE at 4.56e-06, EMA20 at 4.39e-06, now on its 11th candle above. The confirmation level at 4.18e-06 was broken to the downside long ago. There's still 12.7% of room to the invalidation level at 3.98e-06—the widest buffer of the three.
2) ZEC at 1,223, EMA20 at 1,243, now on its 1st candle back below after confirmation. It failed to hold the confirmation level at 1268.34, and the invalidation level at 1178.0 is just 3.7% below—that's one big red candle away.
3) PUMP at 0.003949, EMA20 at 0.004592. Confirmation never came, and the price is already on its 8th candle below EMA20, 15.7% below the invalidation level at 0.004687. By the rules, this setup is already invalidated.
The three assets actually had the same signal starting point. What really separates them isn't the moment of confirmation, but how much distance remains between the price and the invalidation level afterward: the thinner the cushion, the less room for error.
How far is the asset you're watching from its invalidation level, in percentage terms? Share in the comments.
$PEPE $ZEC $PUMP
#EMA20 #结构扫描 #RiskManagement