$IOST / $TAO / $RSR Hourly timeframes are leaning bearish, with short-term pressure 🔥
════════════════════
🟢 $IOST 4-hour bearish signal
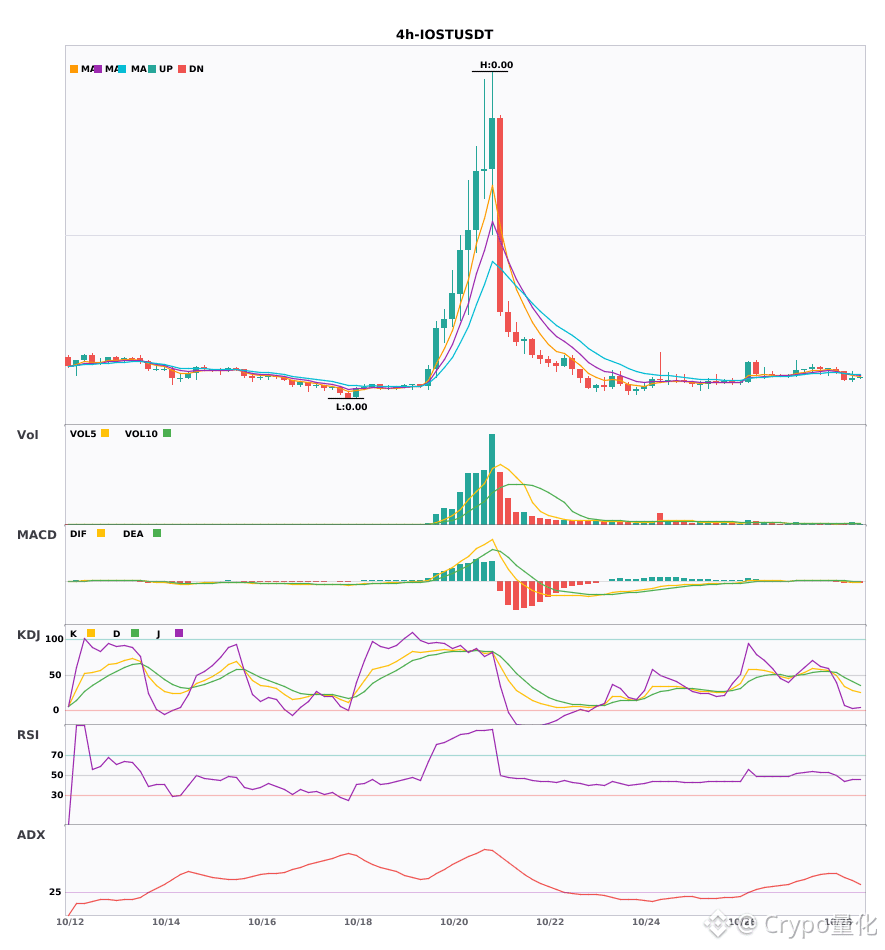
⚠️Technical analysis: ADX(38) indicates a clear trend | MACD DIF has fallen below zero, signaling a bearish trend | EMA5 < EMA8 < EMA13, bearish alignment | KDJ is weak, with bears in control (K is 27.9, D is 40.3) | Volume has increased (1.7x)
════════════════════
🟢 $TAO 4-hour bearish signal
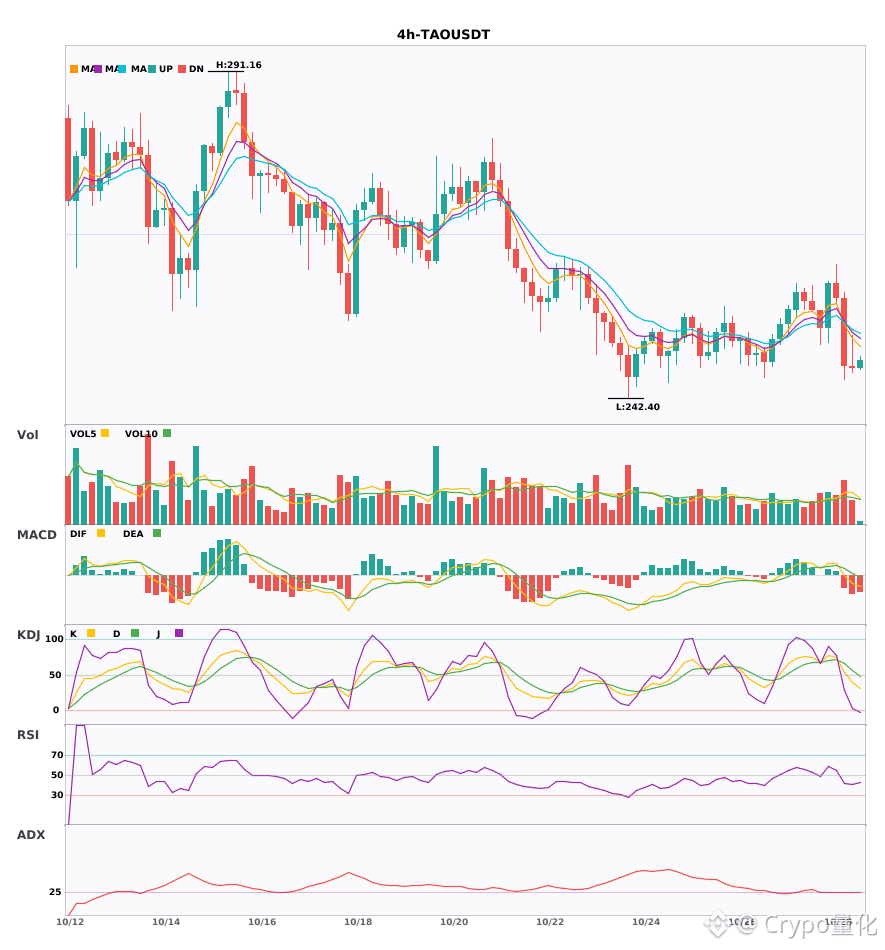
⚠️Technical analysis: ADX(27) indicates a trend is forming and may be worth trading | MACD DIF has fallen below zero, signaling a bearish trend | EMA5 < EMA8 < EMA13, bearish alignment | Volume has increased (1.6x)
════════════════════
🟢 $RSR 4-hour bearish signal
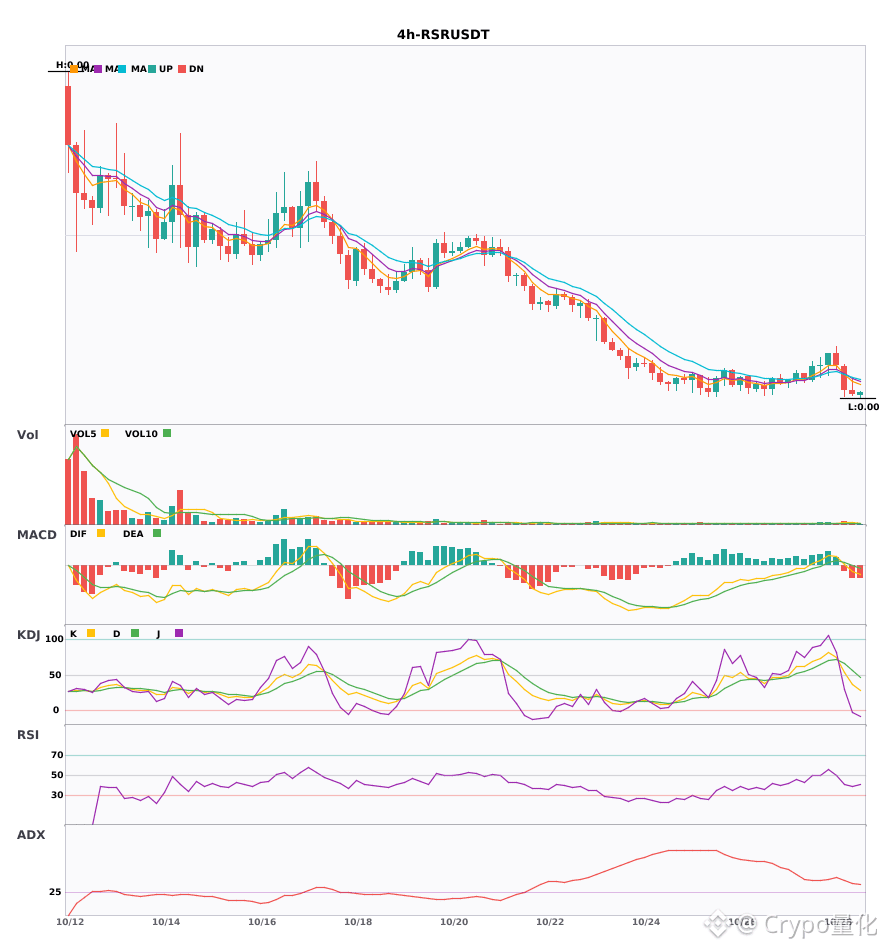
⚠️Technical analysis: ADX(37) indicates a clear trend | MACD DIF has fallen below zero, signaling a bearish trend | EMA5 < EMA8 < EMA13, bearish alignment | Volume has increased (1.8x)
════════════════════
🔔 Follow for real-time market movements 🔔
#技术分析 #IOST #TAO #RSR
📌 When trading, pay attention to whether the candlestick pattern confirms the signal
════════════════════
🟢 $IOST 4-hour bearish signal
⚠️Technical analysis: ADX(38) indicates a clear trend | MACD DIF has fallen below zero, signaling a bearish trend | EMA5 < EMA8 < EMA13, bearish alignment | KDJ is weak, with bears in control (K is 27.9, D is 40.3) | Volume has increased (1.7x)
════════════════════
🟢 $TAO 4-hour bearish signal
⚠️Technical analysis: ADX(27) indicates a trend is forming and may be worth trading | MACD DIF has fallen below zero, signaling a bearish trend | EMA5 < EMA8 < EMA13, bearish alignment | Volume has increased (1.6x)
════════════════════
🟢 $RSR 4-hour bearish signal
⚠️Technical analysis: ADX(37) indicates a clear trend | MACD DIF has fallen below zero, signaling a bearish trend | EMA5 < EMA8 < EMA13, bearish alignment | Volume has increased (1.8x)
════════════════════
🔔 Follow for real-time market movements 🔔
#技术分析 #IOST #TAO #RSR
📌 When trading, pay attention to whether the candlestick pattern confirms the signal