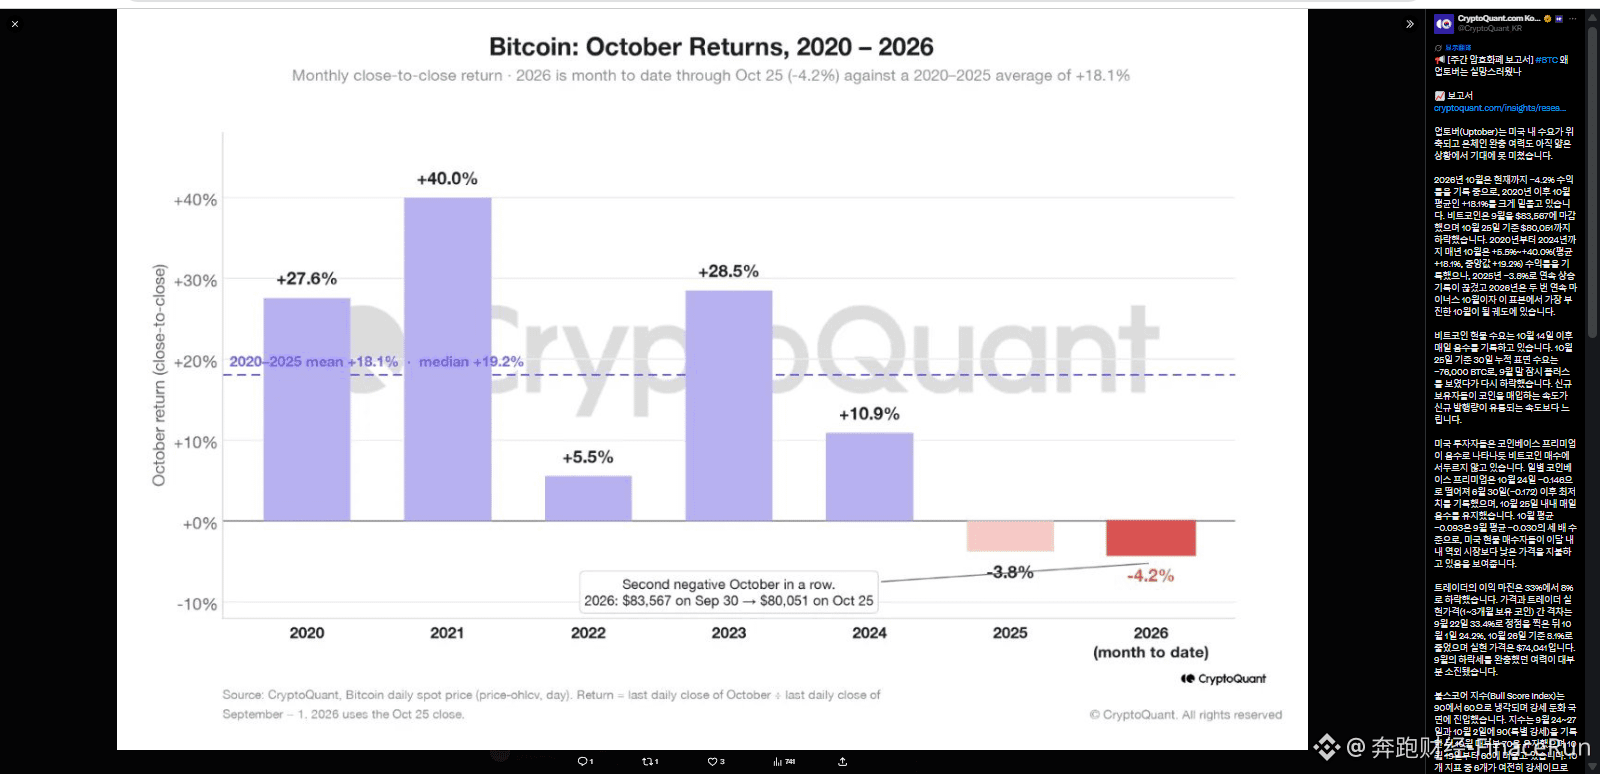
Bitcoin underperforms its historical October average as spot demand and buying in the US market cool
October 29 — Data from CryptoQuant shows that Bitcoin had returned -4.2% through October 25, well below the average October return of 18.1% between 2020 and 2025. This also means BTC could post a monthly loss in October for the second consecutive year.
Bitcoin fell from its September-end closing price of $83,567 to $80,051, a decline of more than 4%. This contrasts sharply with its historical performance over the same period, as market sentiment turns more cautious.
Analysts say weakening demand is the key signal weighing on the market. Data shows that Bitcoin’s daily spot apparent demand has remained negative since October 14, with 30-day apparent demand falling by a cumulative 76,000 BTC.
Meanwhile, buying appetite in the US market has also cooled noticeably. The Coinbase Premium fell to -0.146 on October 24, its lowest level since June 30, and its monthly average has also weakened significantly.
More concerning, the market’s profit cushion is shrinking rapidly. The share of traders in profit has fallen from 33% to 8%, leaving the gains that had buffered the previous downturn largely depleted and adding to market pressure.
At the indicator level, the Bitcoin Bull Score Index has fallen from 90 to 60, signaling a clear slowdown in upward momentum. However, six indicators in the broader set remain strong, so conditions have not yet weakened across the board.
Technically, the report identifies $73,000–$77,600 as a key support zone. Several medium- and long-term moving averages are clustered around 10% below the current price, providing a relatively solid price floor.
In the near term, the Federal Reserve’s rate decision and the November 3 midterm elections will be important events shaping market direction. Investors should closely monitor the volatility risks posed by these macroeconomic factors.
#比特币行情观点