$BTC The market is grinding sideways, so I can’t be bothered to go live. The Fed’s interest rate decision will be announced at 2 a.m. tomorrow. Let’s take a comprehensive look at the current market and forecast where it may go next.
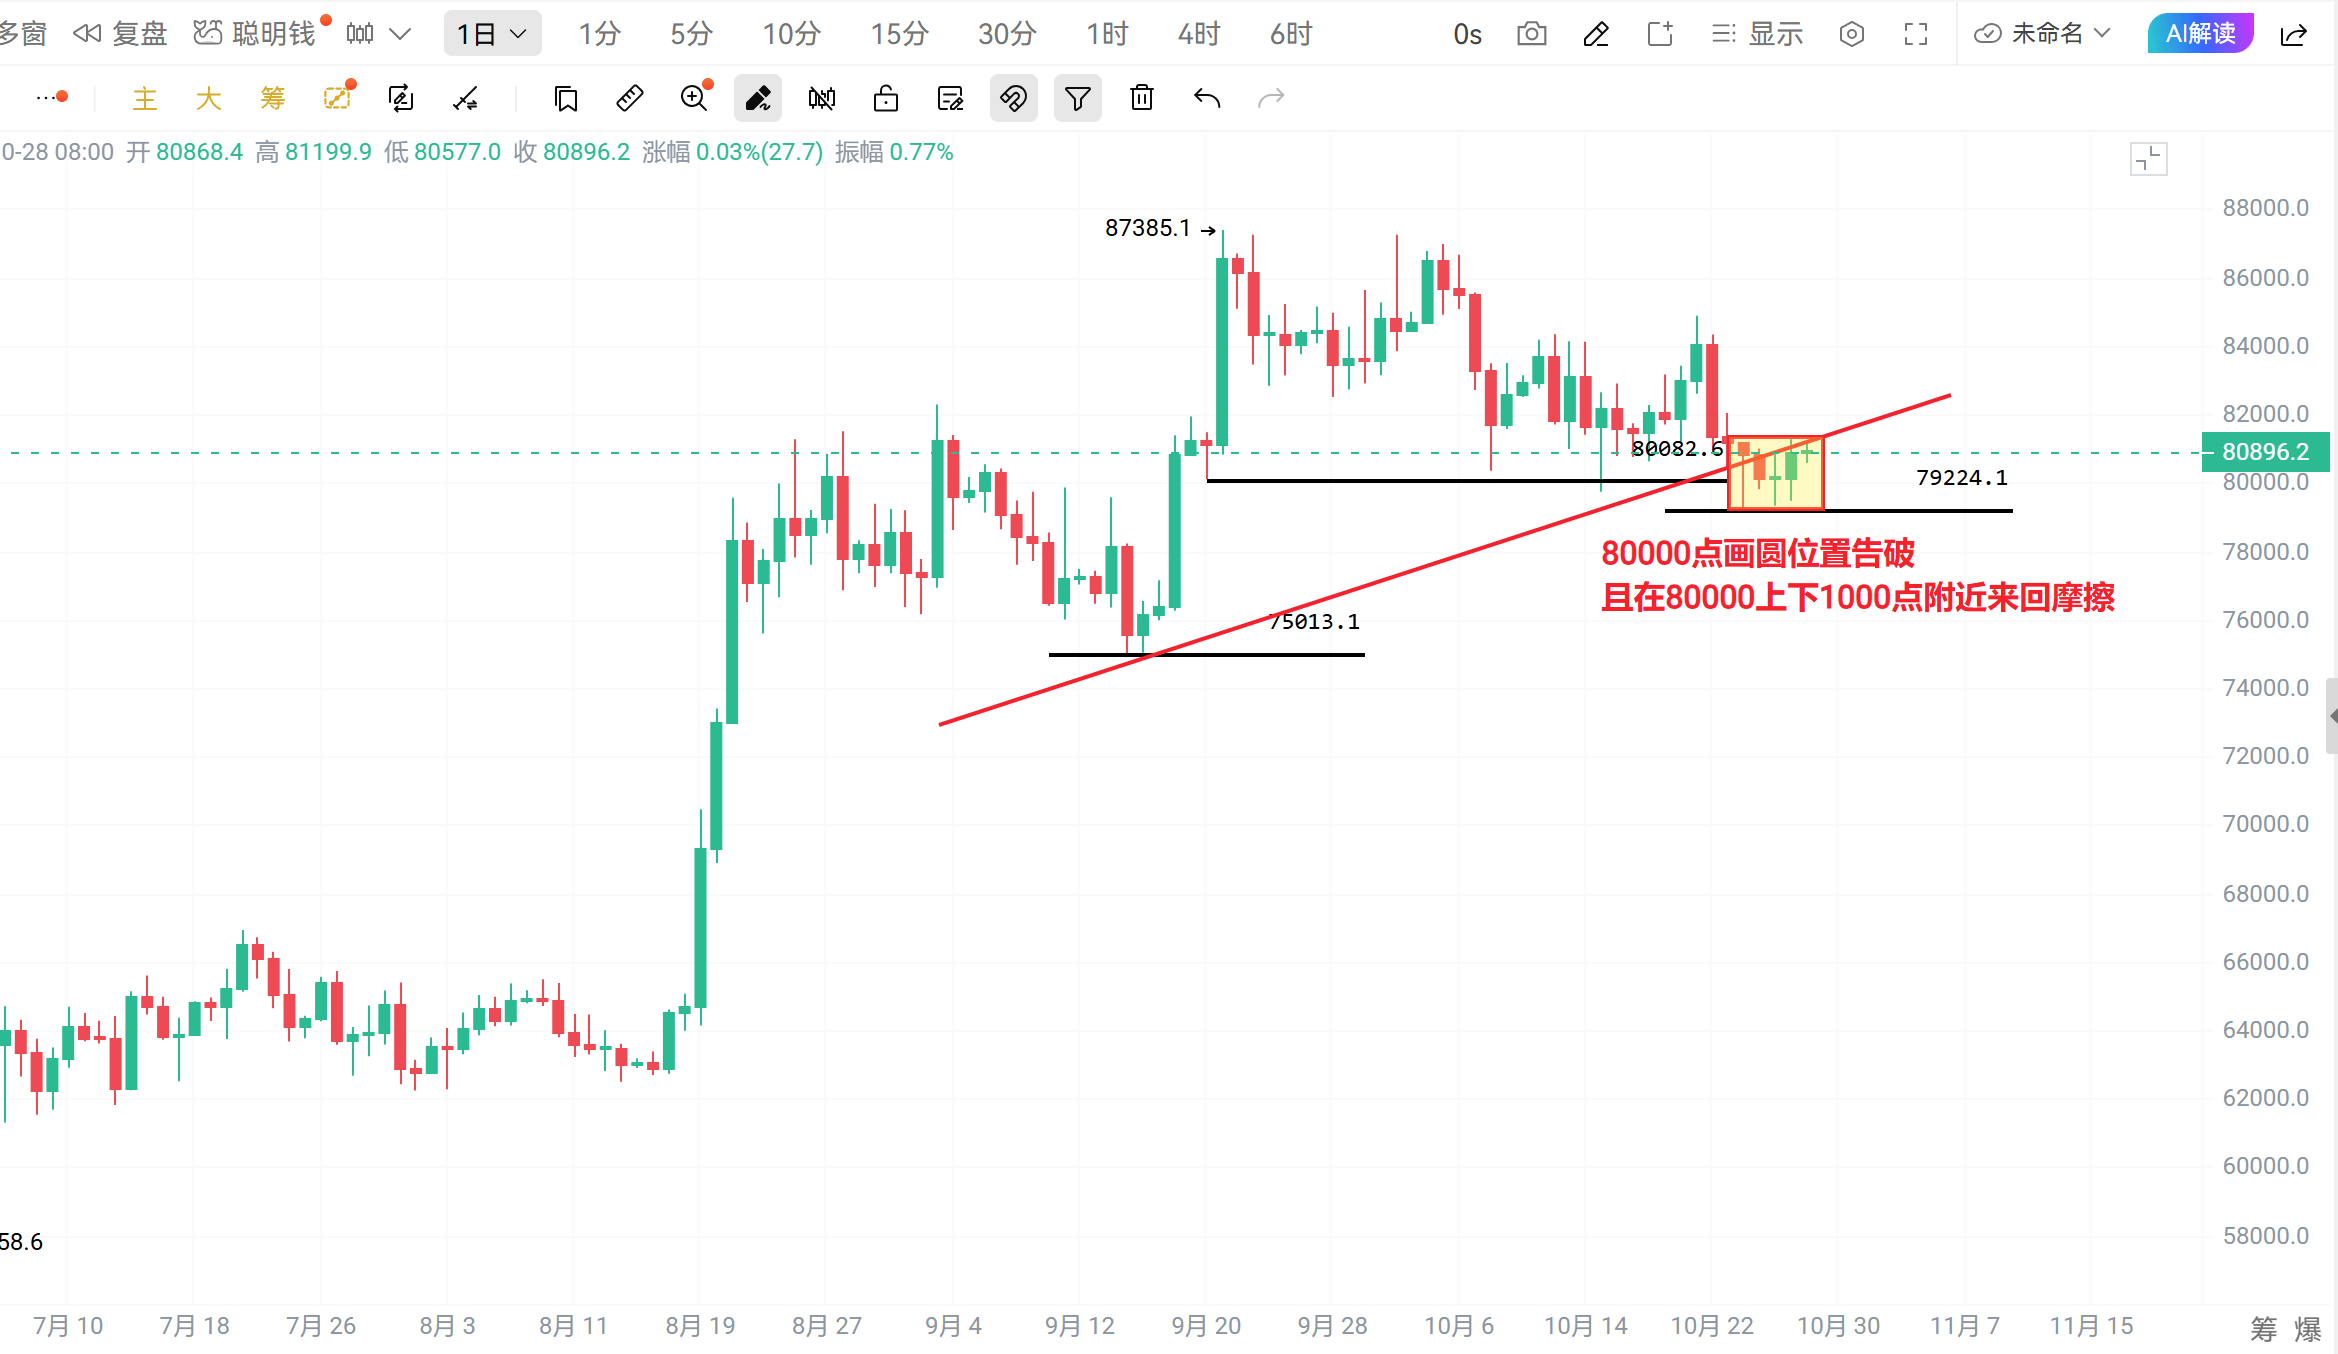
Looking at the naked chart: 80,000 was the low of the pullback after the rally to around 82,000 following the rate hike, and it was also the starting point for the rise to 87,300. In the choppy decline that began at the 87,300 high, 80,000 has held as support for about 20 days. On October 8, the market bottomed at 80,600 without breaking below the 80,000 “door” level, then stopped falling and rose. On October 15, it broke below 80,000 to 79,700, but again stopped falling and rose. On October 24, it dropped from 80,000 to 79,300 before turning back up. Since then, it has been hovering within about 1,000 points of 80,000. Usually, once a “door” level is broken, the market moves into its next phase. But the market has remained so resilient that this could be seen as a rest after a major rally. The BTC price can be flexible, but institutions are protecting the bottom line.
Looking at the indicators: The daily indicators are shaping up reasonably well, but MACD is still below zero. We need the mid-term indicators to turn bullish, with a sharp rally to drive the market higher; otherwise, it will keep grinding sideways. The mid-term indicators haven’t formed perfectly and are lagging, but on the 4-hour chart, MACD has formed a golden cross and is approaching the zero line. After five consecutive bullish candles on VOL5, a bearish candle appeared as a transition. The other 4-hour indicators haven’t formed perfectly either, but they look decent. So the mid-term indicators do have flaws—which is normal. How good can the indicators look when the market is just grinding sideways?
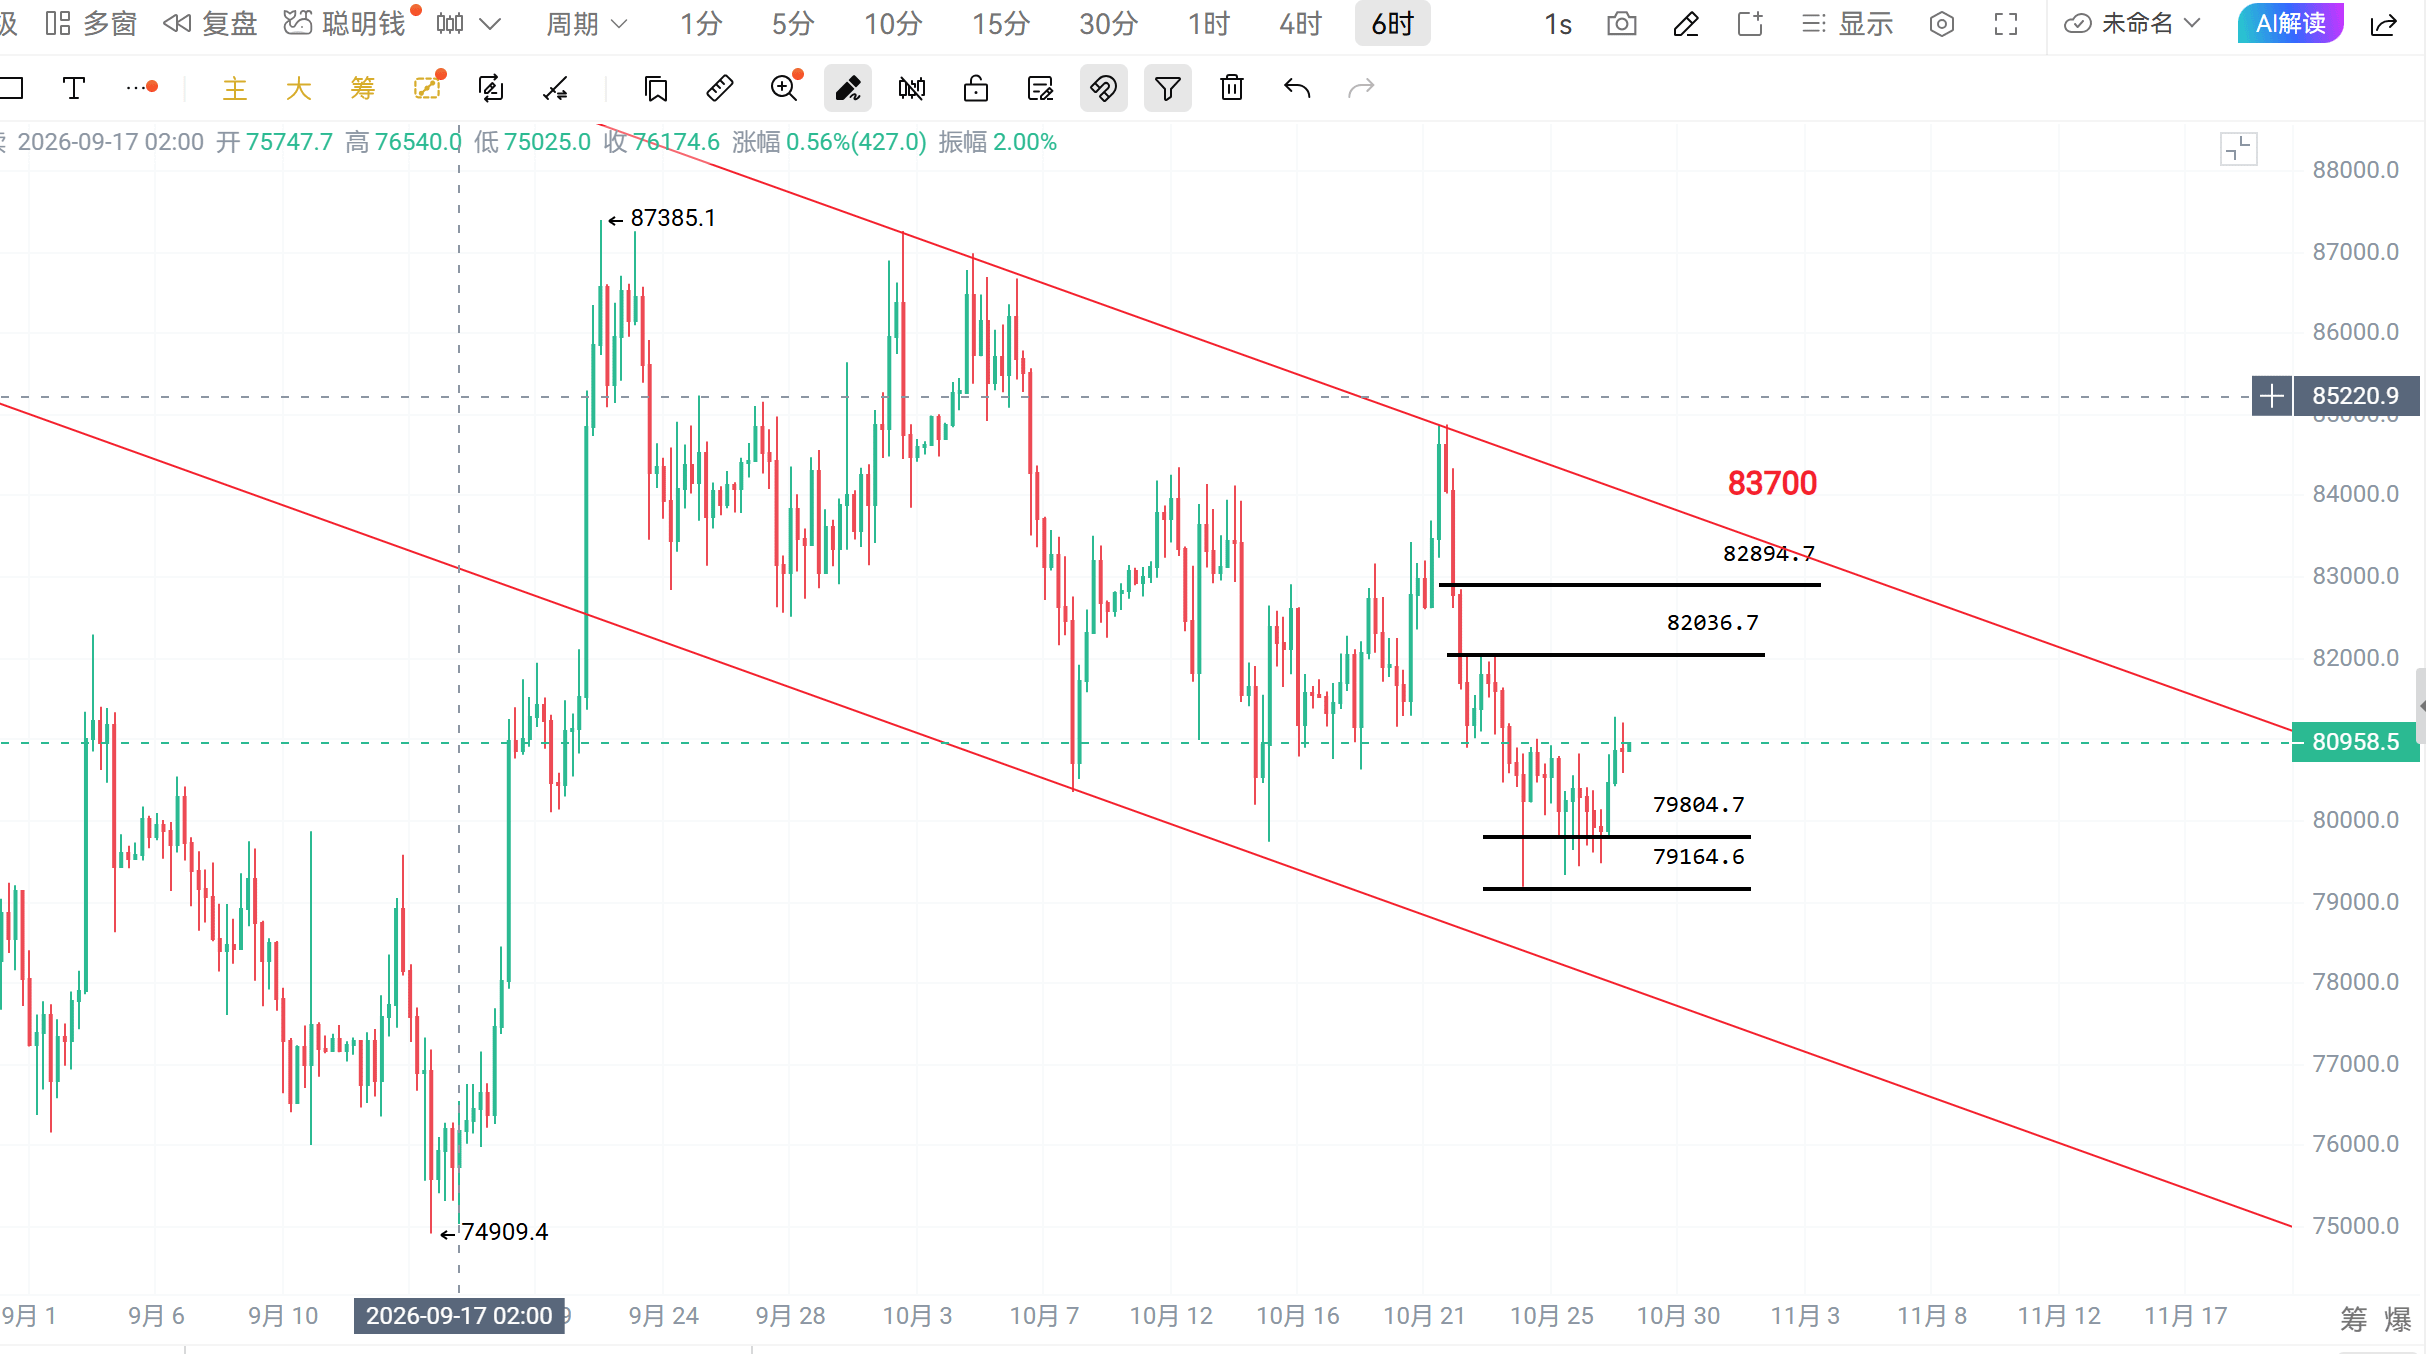
On the weekly chart, after three consecutive weeks of bearish energy being released, bullish energy has emerged. A weekly MACD golden cross breaking above the zero line is all but certain and is now playing out in real time. KDJ has indeed formed a death cross amid the recent choppy decline and is now at 40. The weekly MA configuration has already told us one thing: if we compare a bull market to a rocket, then the current price action is like building the launch site at the Jiuquan Satellite Launch Center. This also aligns with the monthly indicators, which are bullish. But with weekly KDJ at 40, it also makes you wonder whether the market will keep falling, push KDJ to the bottom, then reverse and surge. If so, the market could indeed continue to decline in a choppy fashion. But if the daily indicators form a downtrend, 75,000 won’t hold; the price would need to reach around 73,000 at least. That would break the overall uptrend and conflict with the broader bullish outlook. You could also see it this way: after institutions worked so hard to create bullish momentum in the broader market with the huge rally on August 19, protecting BTC’s price is only natural. (There’s a market recap in the comments.) #分析行情
Looking at the naked chart: 80,000 was the low of the pullback after the rally to around 82,000 following the rate hike, and it was also the starting point for the rise to 87,300. In the choppy decline that began at the 87,300 high, 80,000 has held as support for about 20 days. On October 8, the market bottomed at 80,600 without breaking below the 80,000 “door” level, then stopped falling and rose. On October 15, it broke below 80,000 to 79,700, but again stopped falling and rose. On October 24, it dropped from 80,000 to 79,300 before turning back up. Since then, it has been hovering within about 1,000 points of 80,000. Usually, once a “door” level is broken, the market moves into its next phase. But the market has remained so resilient that this could be seen as a rest after a major rally. The BTC price can be flexible, but institutions are protecting the bottom line.
Looking at the indicators: The daily indicators are shaping up reasonably well, but MACD is still below zero. We need the mid-term indicators to turn bullish, with a sharp rally to drive the market higher; otherwise, it will keep grinding sideways. The mid-term indicators haven’t formed perfectly and are lagging, but on the 4-hour chart, MACD has formed a golden cross and is approaching the zero line. After five consecutive bullish candles on VOL5, a bearish candle appeared as a transition. The other 4-hour indicators haven’t formed perfectly either, but they look decent. So the mid-term indicators do have flaws—which is normal. How good can the indicators look when the market is just grinding sideways?
On the weekly chart, after three consecutive weeks of bearish energy being released, bullish energy has emerged. A weekly MACD golden cross breaking above the zero line is all but certain and is now playing out in real time. KDJ has indeed formed a death cross amid the recent choppy decline and is now at 40. The weekly MA configuration has already told us one thing: if we compare a bull market to a rocket, then the current price action is like building the launch site at the Jiuquan Satellite Launch Center. This also aligns with the monthly indicators, which are bullish. But with weekly KDJ at 40, it also makes you wonder whether the market will keep falling, push KDJ to the bottom, then reverse and surge. If so, the market could indeed continue to decline in a choppy fashion. But if the daily indicators form a downtrend, 75,000 won’t hold; the price would need to reach around 73,000 at least. That would break the overall uptrend and conflict with the broader bullish outlook. You could also see it this way: after institutions worked so hard to create bullish momentum in the broader market with the huge rally on August 19, protecting BTC’s price is only natural. (There’s a market recap in the comments.) #分析行情