




Bitcoin spot ETFs have seen net inflows for two days in a row. Is the market about to reverse?
From October 22 to 23, U.S. spot BTC ETFs recorded combined net outflows of about $774 million. From October 26 to 27, flows turned positive again, with combined net inflows of about $135 million.
Fund flows have improved, but inflows over the past two days are still modest compared with the earlier outflows. This points to some positive changes in the market, but it’s not enough to confirm that BTC has reversed course.
Next, keep an eye on three key signals: ETF fund flows, genuine buying activity in the spot market, and the Federal Reserve’s interest rate decisions.

1. Start with recent data: ETF flows have shifted
Recently, flows into U.S. spot BTC ETFs have shifted from large net inflows to concentrated net outflows, and then back to net inflows for two consecutive days.
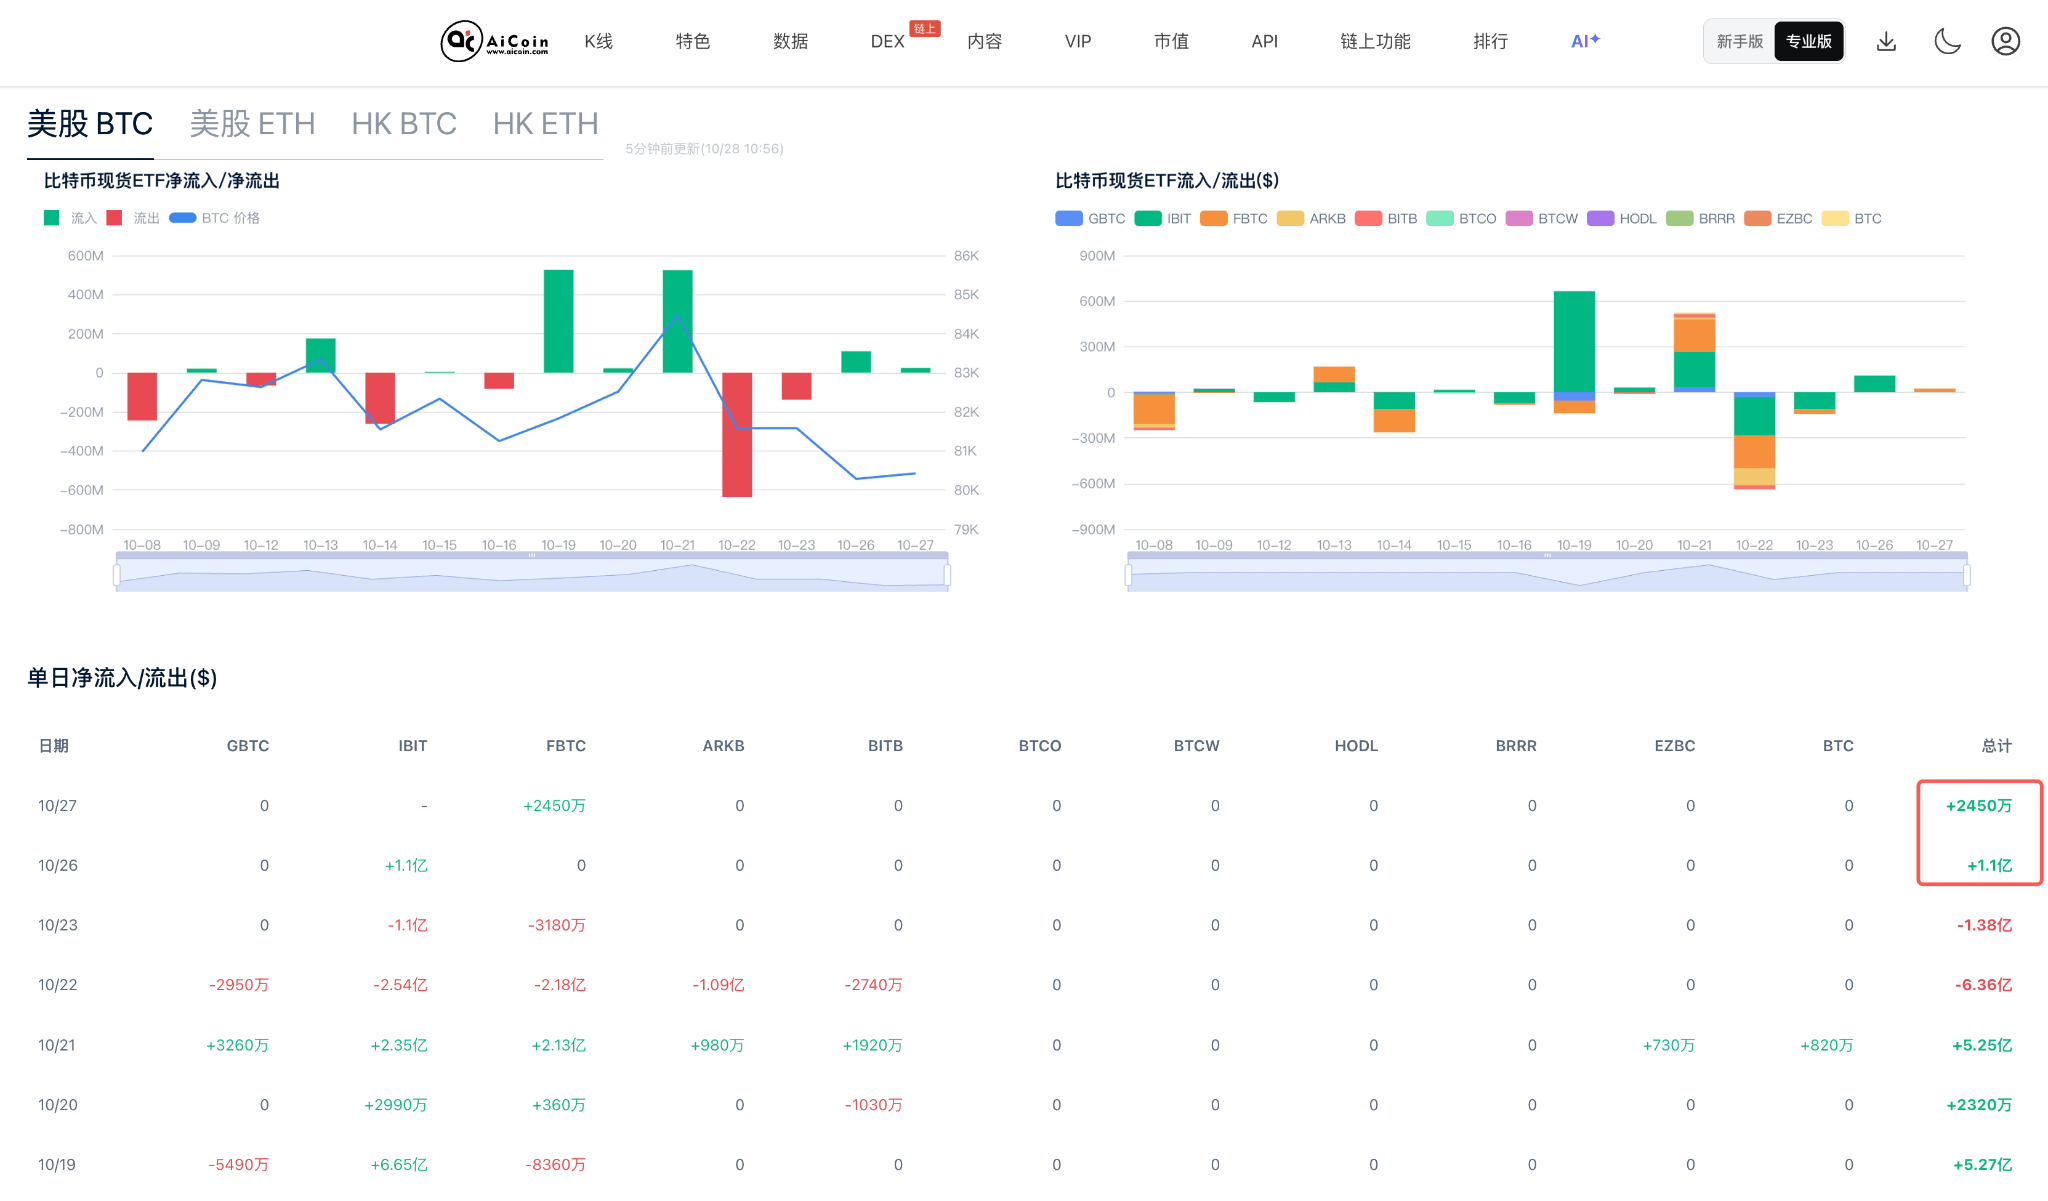
Source: AiCoin U.S. spot BTC ETF flows
https://www.aicoin.com/zh-Hans/web3-etf/us-btc
A net inflow into an ETF usually means that net subscriptions to the fund are positive; a net outflow means that redemptions and other outflows exceed inflows.
Spot BTC ETFs hold assets linked to the price of Bitcoin, so this data can help us track changes in demand for these funds and the participation of some institutional investors.
However, ETF inflows don’t guarantee that BTC will rise, and outflows don’t mean the price must fall. When assessing the situation, start by looking at three things:
How large are the flows? Inflows of tens of millions of dollars send a different signal from inflows of hundreds of millions.
How long do they last? Inflows over several consecutive days are more noteworthy than a single day of inflows.
How is the price reacting? If funds continue to flow in but BTC still fails to gain strength, there may be other selling pressure in the market.
Recent data shows that ETF flows have eased somewhat for now, but it remains to be seen whether they will develop into sustained buying.
2. Why might BTC still weaken when ETFs see inflows?
ETFs are just one window into market flows; they don’t represent the entire spot market.
Market analysis from CryptoQuant indicates that spot demand for BTC remains weak. Even if ETFs return to net inflows, prices may not find sustained support if buying in the broader spot market is insufficient.
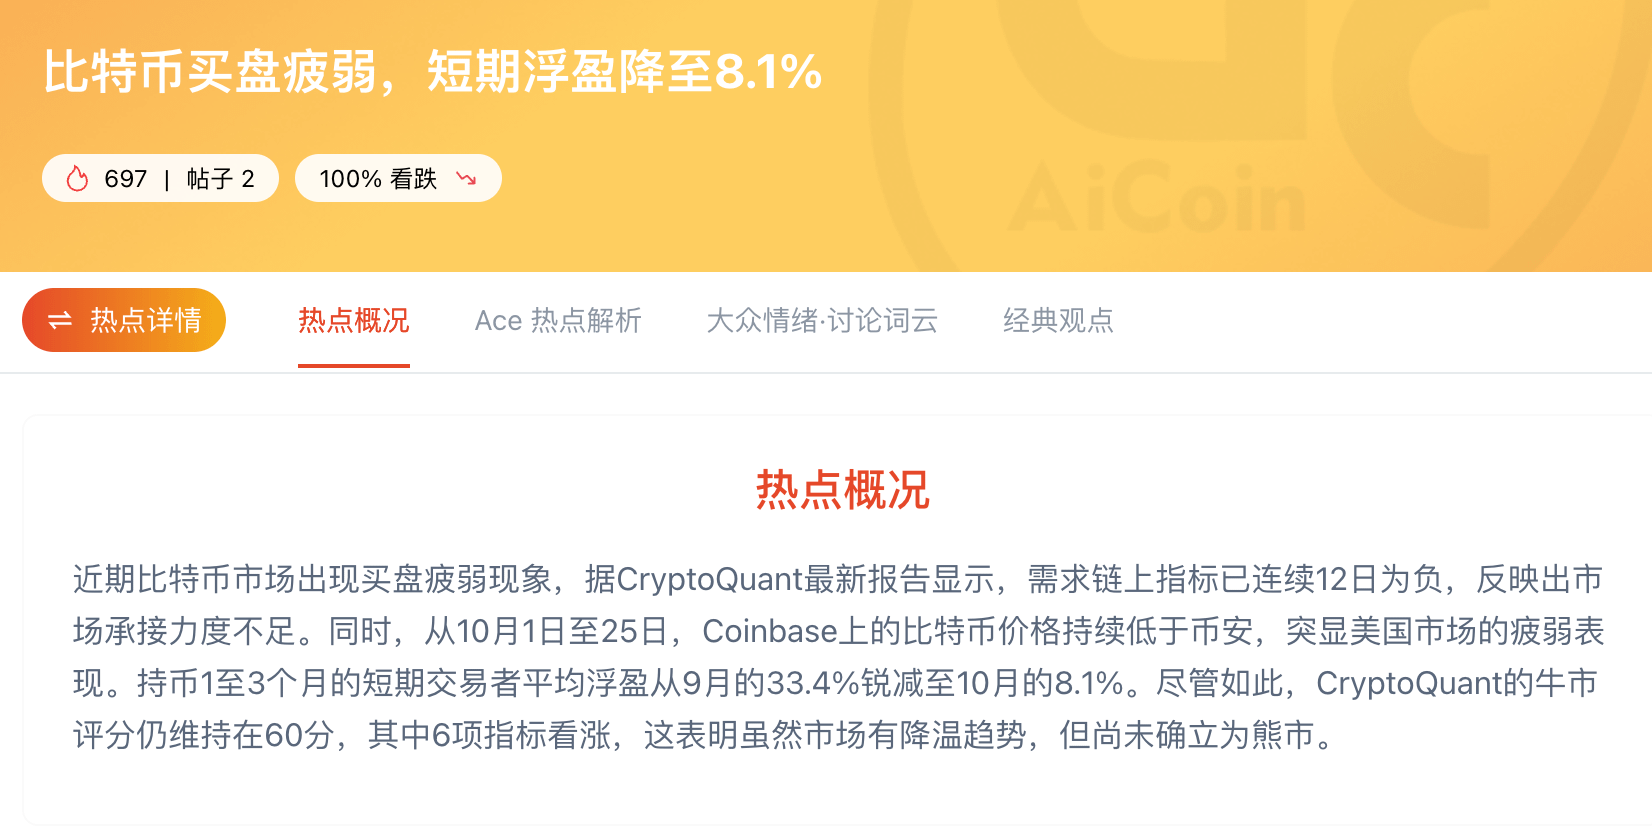
Beginners can also keep an eye on one indicator: the Coinbase premium.
Put simply, it compares BTC prices on Coinbase and Binance. If BTC is consistently cheaper on Coinbase than on Binance, it may indicate relatively weak buying on Coinbase. If BTC is consistently more expensive on Coinbase, it may reflect relatively strong buying demand on that platform.
However, price differences between the two platforms can also be affected by factors such as trading pairs and liquidity. The Coinbase premium is only a supplementary indicator; on its own, it cannot confirm that U.S. investors are buying or selling.
So, to judge whether the market is genuinely improving, don’t look only at whether ETFs are seeing net inflows. Also check whether spot demand and price action confirm each other.
3. The Fed decision may be the next test
On October 29, the Fed will announce its rate decision and hold a press conference.
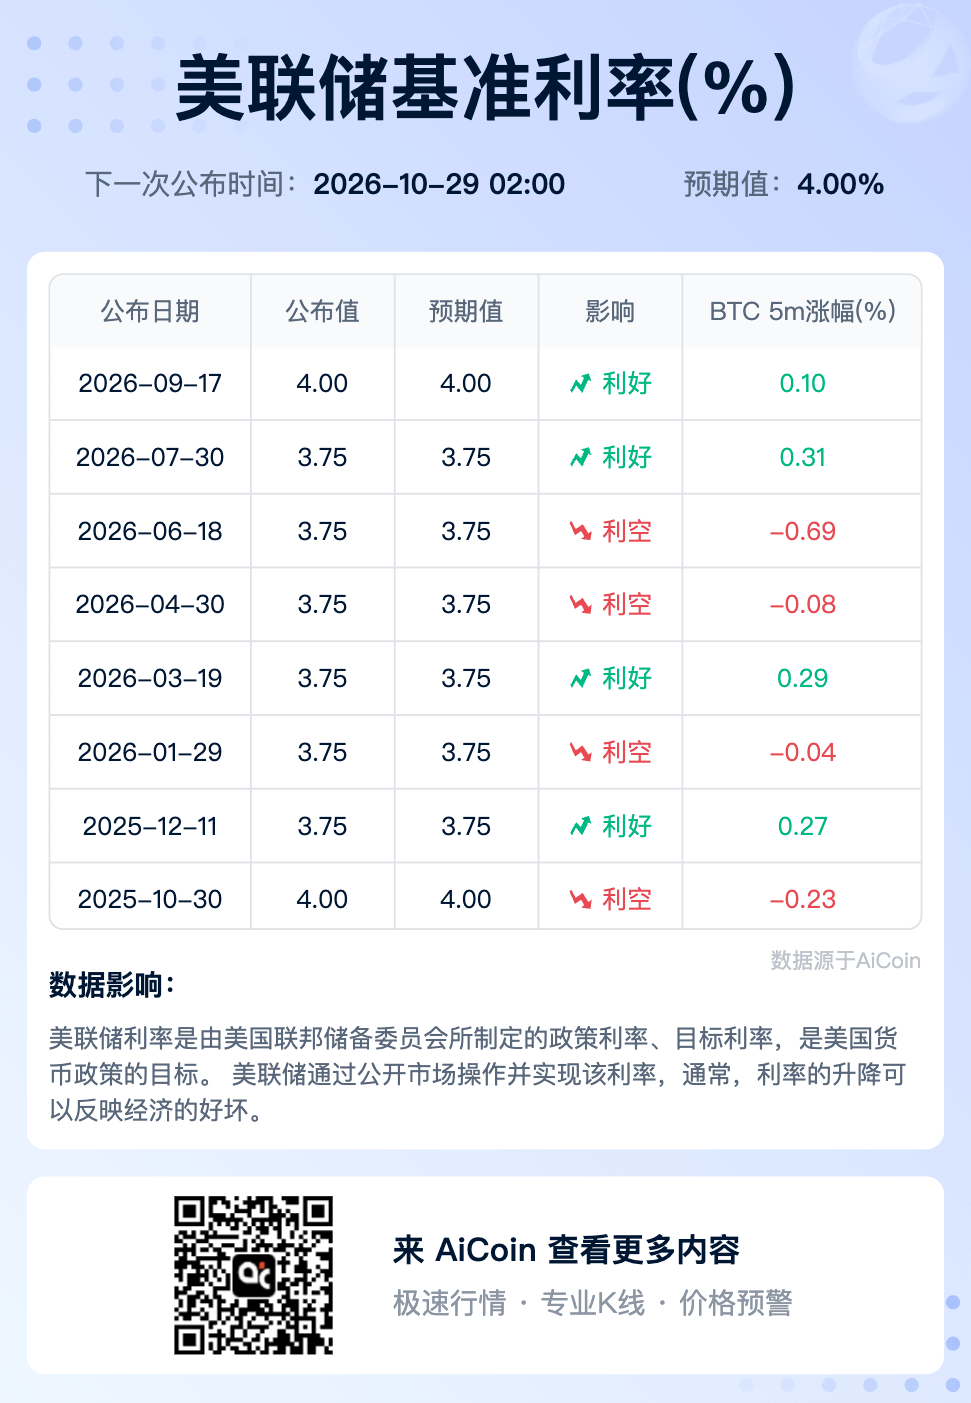
Markets are watching not only whether interest rates change, but also the policy guidance and the Fed’s assessment of inflation and the economic outlook.
This information could affect the U.S. dollar, Treasury yields, and market risk appetite, with knock-on effects for risk assets such as BTC.
There are two things to watch next:
Have interest rate expectations changed? If the market revises its view of the future rate path, risk assets may fluctuate accordingly.
How prices react after the decision is announced: Even if the outcome is in line with expectations, remarks at the press conference could still affect market movements. Don’t just read the headlines—watch how BTC and U.S. stocks actually react.
It’s important to remember that the relationship between Fed policy and BTC is not a simple one-way street. Markets often price in expectations in advance, and the eventual direction depends on how the policy outcome compares with prior expectations, as well as on other market factors.
4. Three Signals Beginners Should Understand
Next, consider focusing on three indicators you can track over time.
1. ETF flows: See whether funds are consistently returning
Don’t assume the trend has reversed just because there have been net inflows for two consecutive days. It’s worth looking at how persistent the inflows are, how large they are, and whether they are supporting prices.
2. Spot demand: See whether there is genuine buying in the market
In addition to ETF data, you can also look at spot trading volume, how well prices are supported during pullbacks, and supplementary indicators such as the Coinbase premium. Multiple signals that confirm one another are more reliable than focusing on a single indicator.
3. Fed decision: See how macroeconomic expectations change
Pay close attention to the rate decision, policy guidance, and market reaction. Macroeconomic news may cause short-term volatility, but it doesn’t mean BTC will necessarily move in a particular direction.
Conclusion
Two consecutive days of net inflows into BTC ETFs are certainly worth noting, but they are not enough to confirm a trend reversal at this point.
What’s more important to watch is whether ETF funds continue to flow back in, whether spot buying improves, and whether BTC can gradually stabilize. The more these signals confirm one another, the better-founded your assessment will be.
If there isn’t a suitable entry opportunity right now, you don’t need to force a trade just to participate in the market. Understanding market developments is important, but so is knowing when to keep watching.
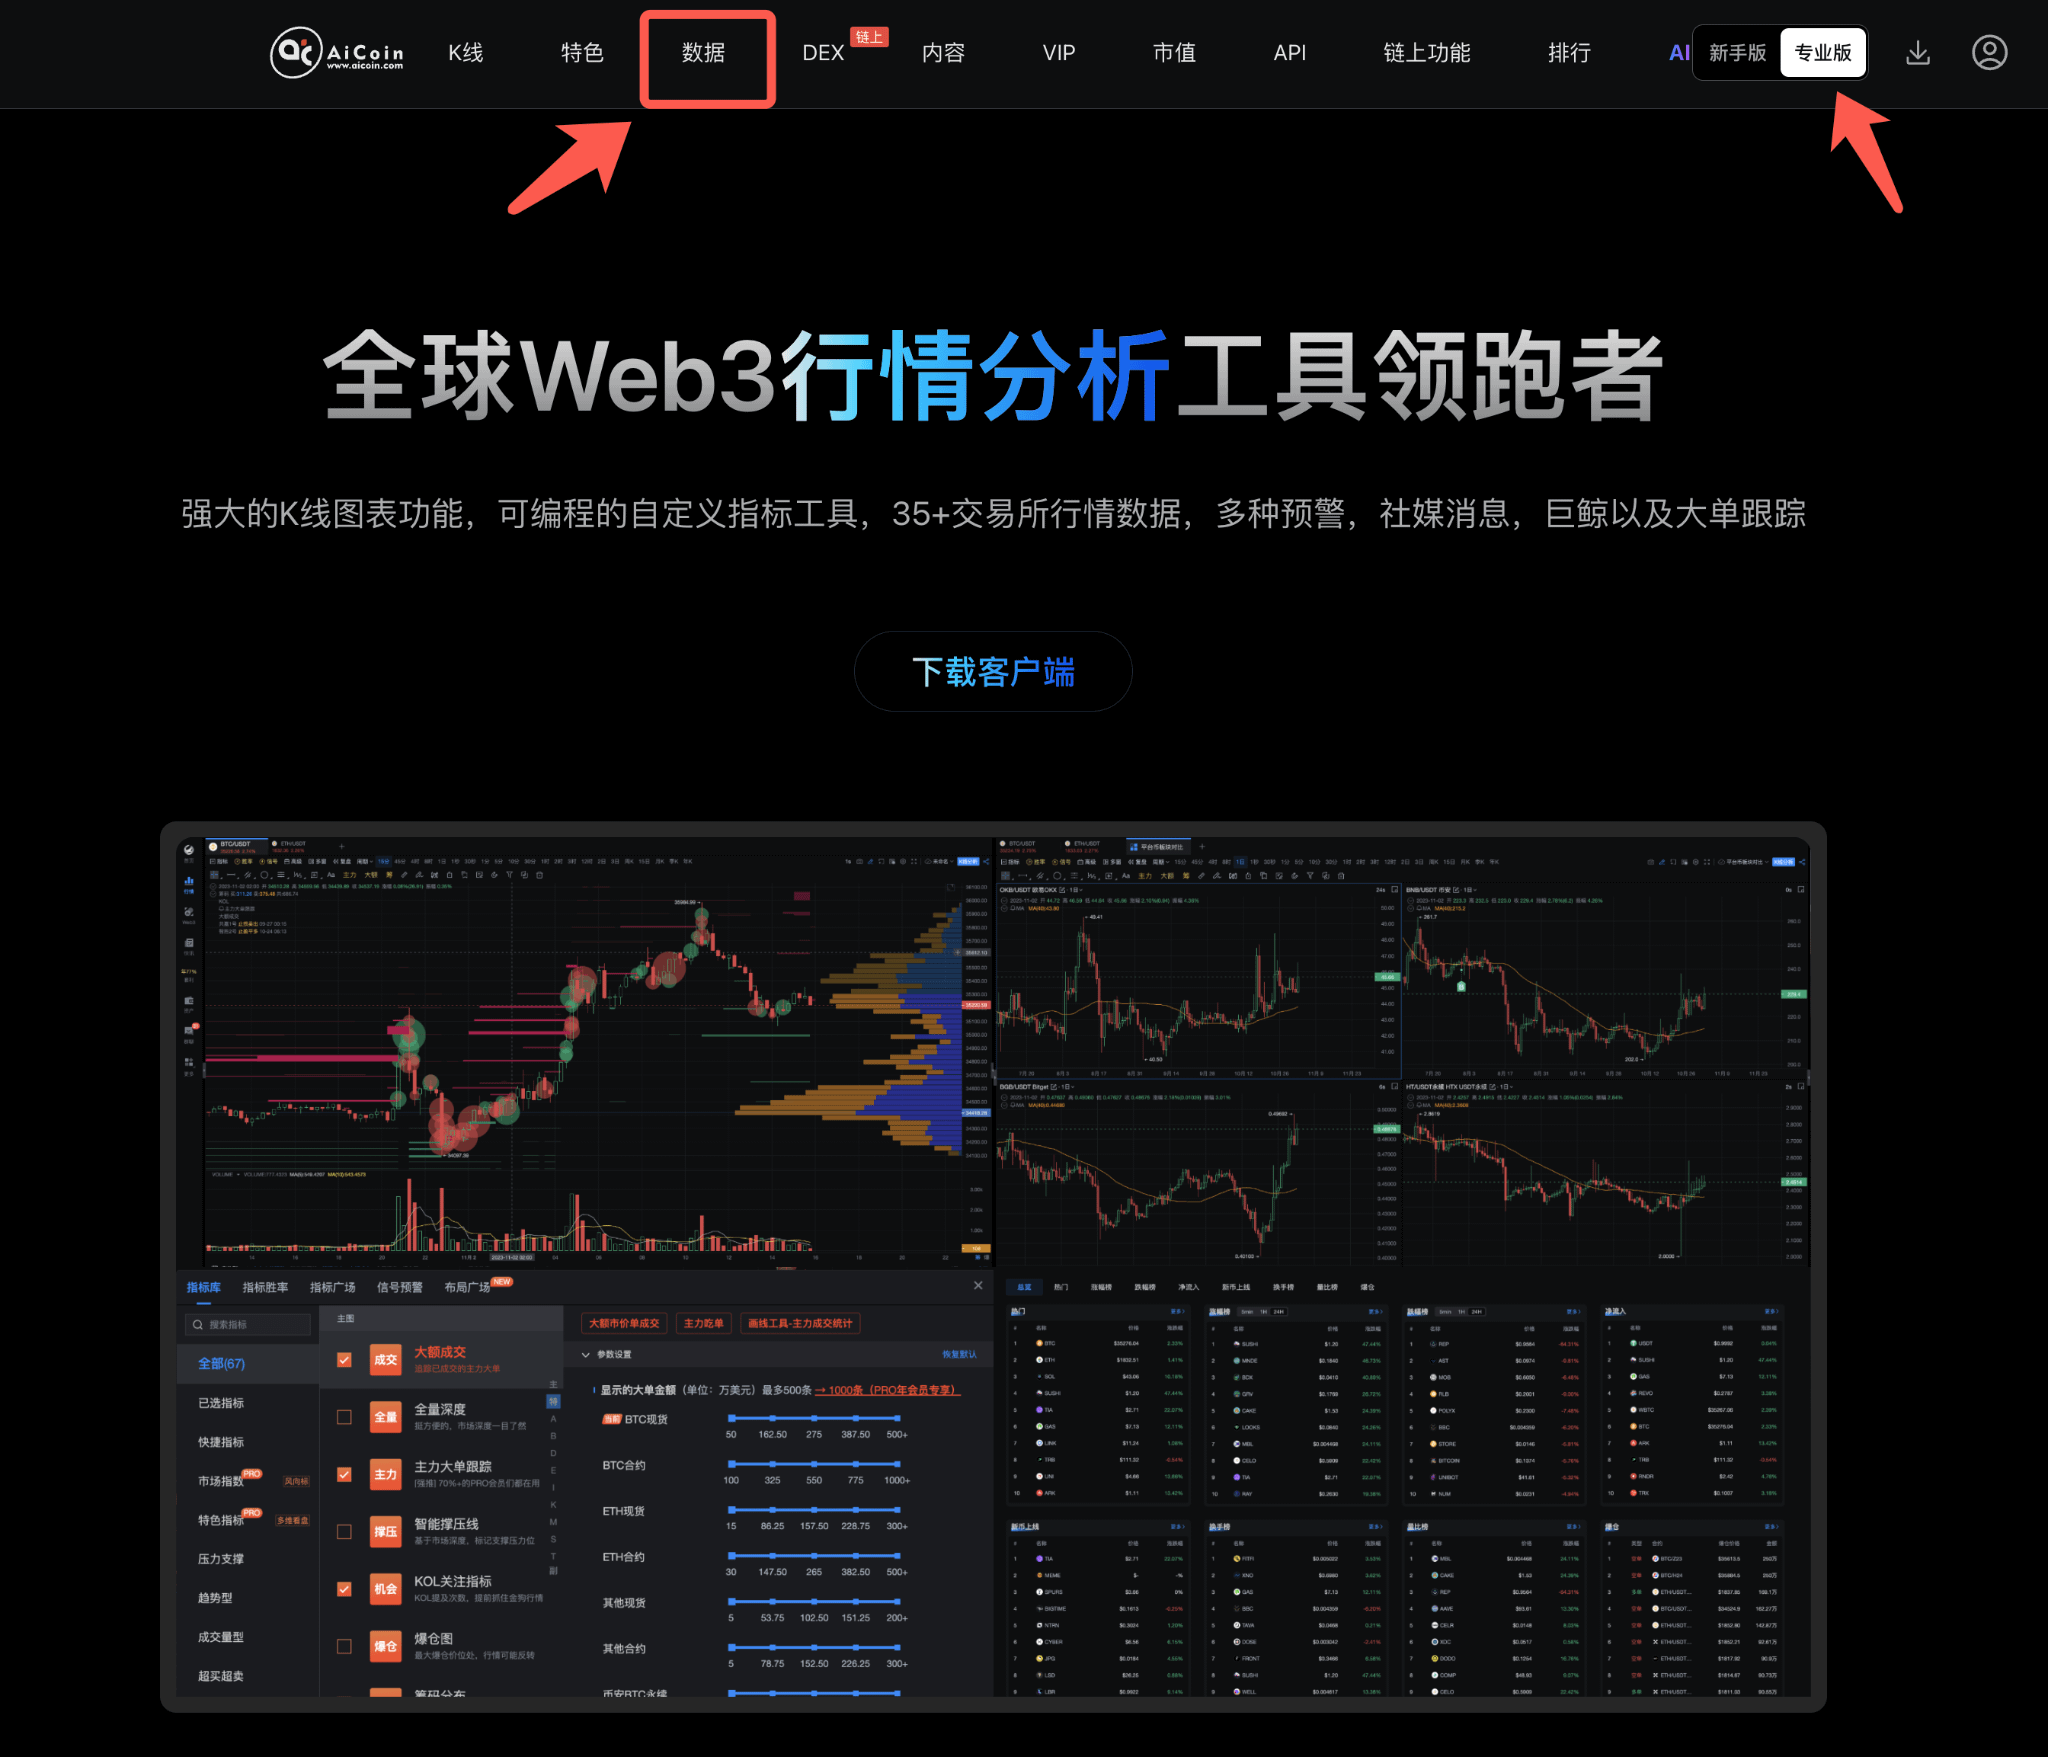
To keep track of ETF flows, BTC price movements, and other data, visit the AiCoin website (aicoin.com), switch to [Professional Edition], and click [Data] on the homepage to view the relevant indicators. Looking at fund flows alongside price movements can help you assess market conditions more comprehensively.
If you don’t have a Binance account yet, you can register using the link below:
👉 https://jump.do/zh-Hans/xlink-proxy?id=3
(Referral code: aicoin668, enjoy a 10% commission rebate)
Existing users can also check out the platform’s USDC holding rewards campaign. Eligible users can receive a 2% bonus reward. Please refer to the campaign rules for details.
Markets change every day. First understand the signals from fund flows and price movements, then decide whether to act. Wishing everyone successful trading—please manage your risk.
Join our community to discuss and grow stronger together!
Official Telegram community: https://t.me/aicoin_support
AiCoin Chinese X account: https://x.com/AiCoinzh
Binance benefits group:
https://www.aicoin.com/link/chat?cid=gmLgwvKD1
Risk disclaimer: This article is for market information purposes only and does not constitute investment advice. Crypto asset prices are highly volatile; please make decisions with caution.