

Vortex info 2
8 Posts

Vortex info 2
Report
Block User
1 Following
2 Followers
14 Liked
Posts
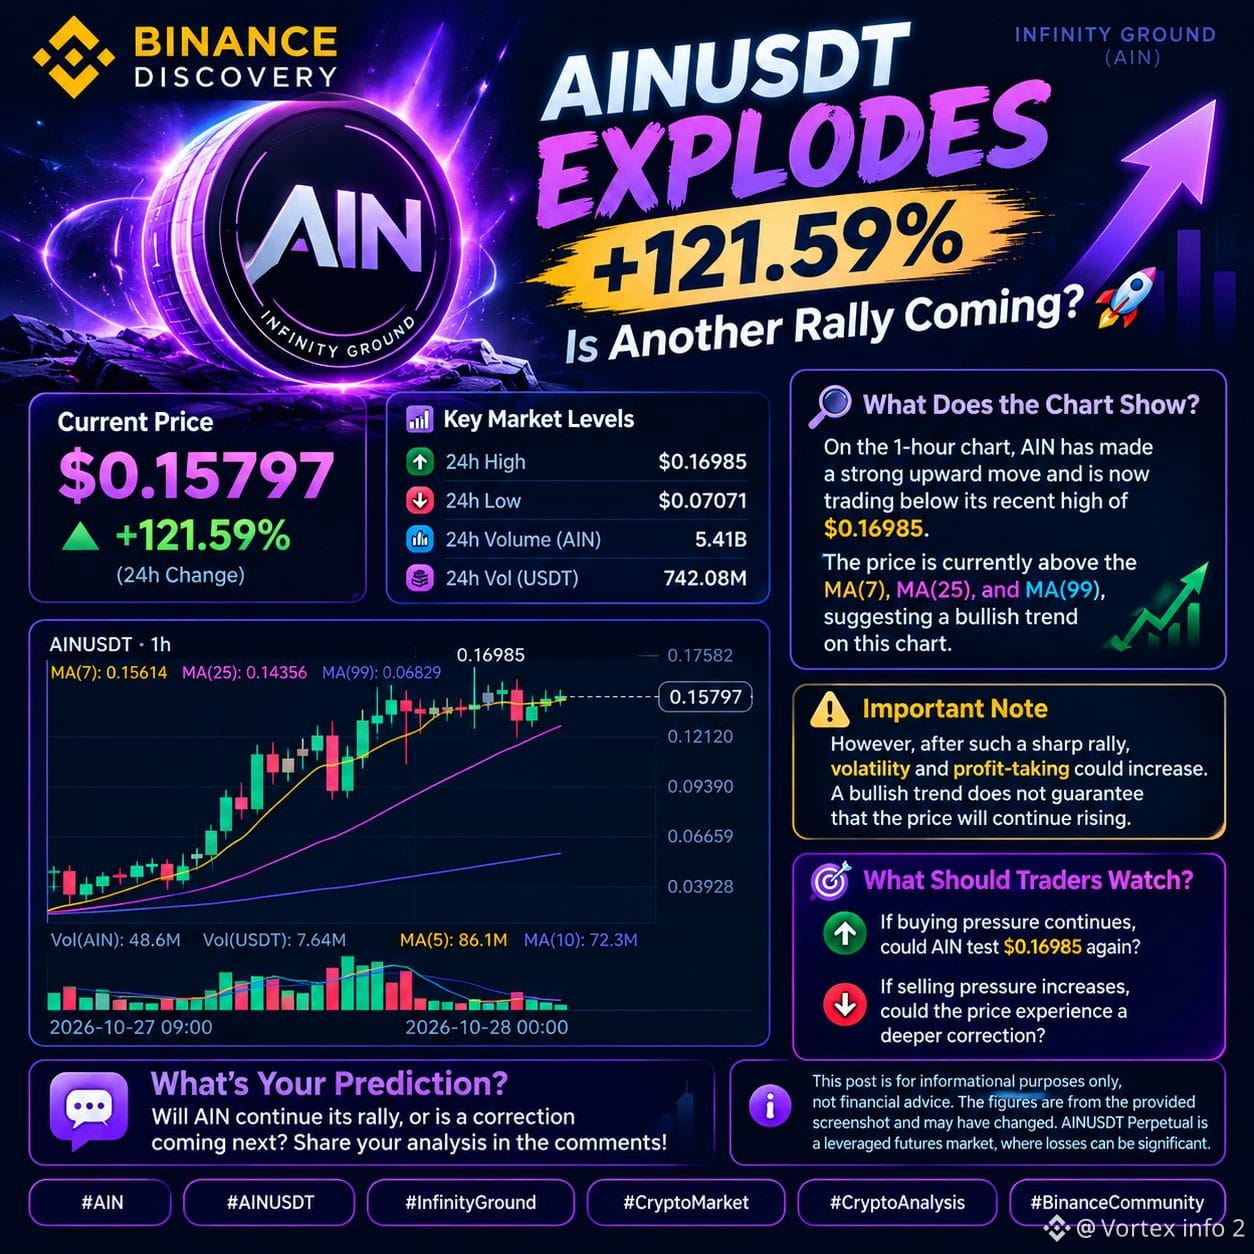
🚀 AINUSDT Explodes +121.59% — Is Another Rally Coming? 📈
🔥 Current Price: $0.15797
AIN (Infinity Ground) is attracting attention after a massive price increase. According to the chart screenshot, AIN is trading at $0.15797, up 121.59% in 24 hours.
📊 Key Market Levels
💰 Current Price: $0.15797
🟢 24h High: $0.16985
🔴 24h Low: $0.07071
📈 24h Change: +121.59%
📊 24h Trading Volume: 742.08M USDT
🔍 What Does the Chart Show?
On the 1-hour chart, AIN has made a strong upward move and is now trading below its recent high of $0.16985. The price is currently above the MA(7), MA(25), and MA(99), suggesting a bullish trend on this chart.$AIN
⚠️ However, after such a sharp rally, volatility and profit-taking could increase. A bullish trend does not guarantee that the price will continue rising.$AIN
🎯 What Should Traders Watch?
📈 If buying pressure continues, could AIN test $0.16985 again?
📉 If selling pressure increases, could the price experience a deeper correction?
💬 What's Your Prediction? Will AIN continue its rally, or is a correction coming next? Share your analysis in the comments!
⚠️ This post is for informational purposes only, not financial advice. The figures are from the provided screenshot and may have changed. AINUSDT Perpetual is a leveraged futures market, where losses can be significant.
#AIN #AINUSDT #InfinityGround #CryptoMarket #CryptoAnalysis #BinanceCommunity
$AIN
{future}(AINUSDT)
🚀 AINUSDT Explodes +121.59% — Is Another Rally Coming? 📈
🔥 Current Price: $0.15797
AIN (Infinity Ground) is attracting attention after a massive price increase. According to the chart screenshot, AIN is trading at $0.15797, up 121.59% in 24 hours.
📊 Key Market Levels
💰 Current Price: $0.15797
🟢 24h High: $0.16985
🔴 24h Low: $0.07071
📈 24h Change: +121.59%
📊 24h Trading Volume: 742.08M USDT
🔍 What Does the Chart Show?
On the 1-hour chart, AIN has made a strong upward move and is now trading below its recent high of $0.16985. The price is currently above the MA(7), MA(25), and MA(99), suggesting a bullish trend on this chart.$AIN
⚠️ However, after such a sharp rally, volatility and profit-taking could increase. A bullish trend does not guarantee that the price will continue rising.$AIN
🎯 What Should Traders Watch?
📈 If buying pressure continues, could AIN test $0.16985 again?
📉 If selling pressure increases, could the price experience a deeper correction?
💬 What's Your Prediction? Will AIN continue its rally, or is a correction coming next? Share your analysis in the comments!
⚠️ This post is for informational purposes only, not financial advice. The figures are from the provided screenshot and may have changed. AINUSDT Perpetual is a leveraged futures market, where losses can be significant.
#AIN #AINUSDT #InfinityGround #CryptoMarket #CryptoAnalysis #BinanceCommunity
$AIN
151
🔥 TOP TRENDING COINS TODAY! 🚀
Which crypto coin are you watching today? 👀
$BTC
{future}(BTCUSDT)
$HYPE
{future}(HYPEUSDT)
$QNT
{future}(QNTUSDT)
🥇 $HYPE
🥈 $DACITY
🥉 $BTC
4️⃣ $PEARL
5️⃣ $ZEC
6️⃣ $QNT
7️⃣ $XMR
8️⃣ $PENGU
9️⃣ $MON
🔟 $NEAR
1️⃣1️⃣ $PUMP
1️⃣2️⃣ $GRASS
1️⃣3️⃣ $SOL
1️⃣4️⃣ $STRK
1️⃣5️⃣ $APR
💎 Which coin do you think has the biggest potential?
📈 Which one could make the next big move?
💬 Drop your favorite coin in the comments below! 👇
❤️ Like • 🔁 Share • 💬 Discuss
⚠️ Remember: A trending coin isn't guaranteed to rise. Always do your own research before making any trading decisions.
#Crypto #TrendingCoins #Bitcoin #BTC #HYPE #ZEC #SOL #CryptoTrading
🔥 TOP TRENDING COINS TODAY! 🚀
Which crypto coin are you watching today? 👀
$BTC
$HYPE
$QNT
🥇 $HYPE
🥈 $DACITY
🥉 $BTC
4️⃣ $PEARL
5️⃣ $ZEC
6️⃣ $QNT
7️⃣ $XMR
8️⃣ $PENGU
9️⃣ $MON
🔟 $NEAR
1️⃣1️⃣ $PUMP
1️⃣2️⃣ $GRASS
1️⃣3️⃣ $SOL
1️⃣4️⃣ $STRK
1️⃣5️⃣ $APR
💎 Which coin do you think has the biggest potential?
📈 Which one could make the next big move?
💬 Drop your favorite coin in the comments below! 👇
❤️ Like • 🔁 Share • 💬 Discuss
⚠️ Remember: A trending coin isn't guaranteed to rise. Always do your own research before making any trading decisions.
#Crypto #TrendingCoins #Bitcoin #BTC #HYPE #ZEC #SOL #CryptoTrading

1
1
334
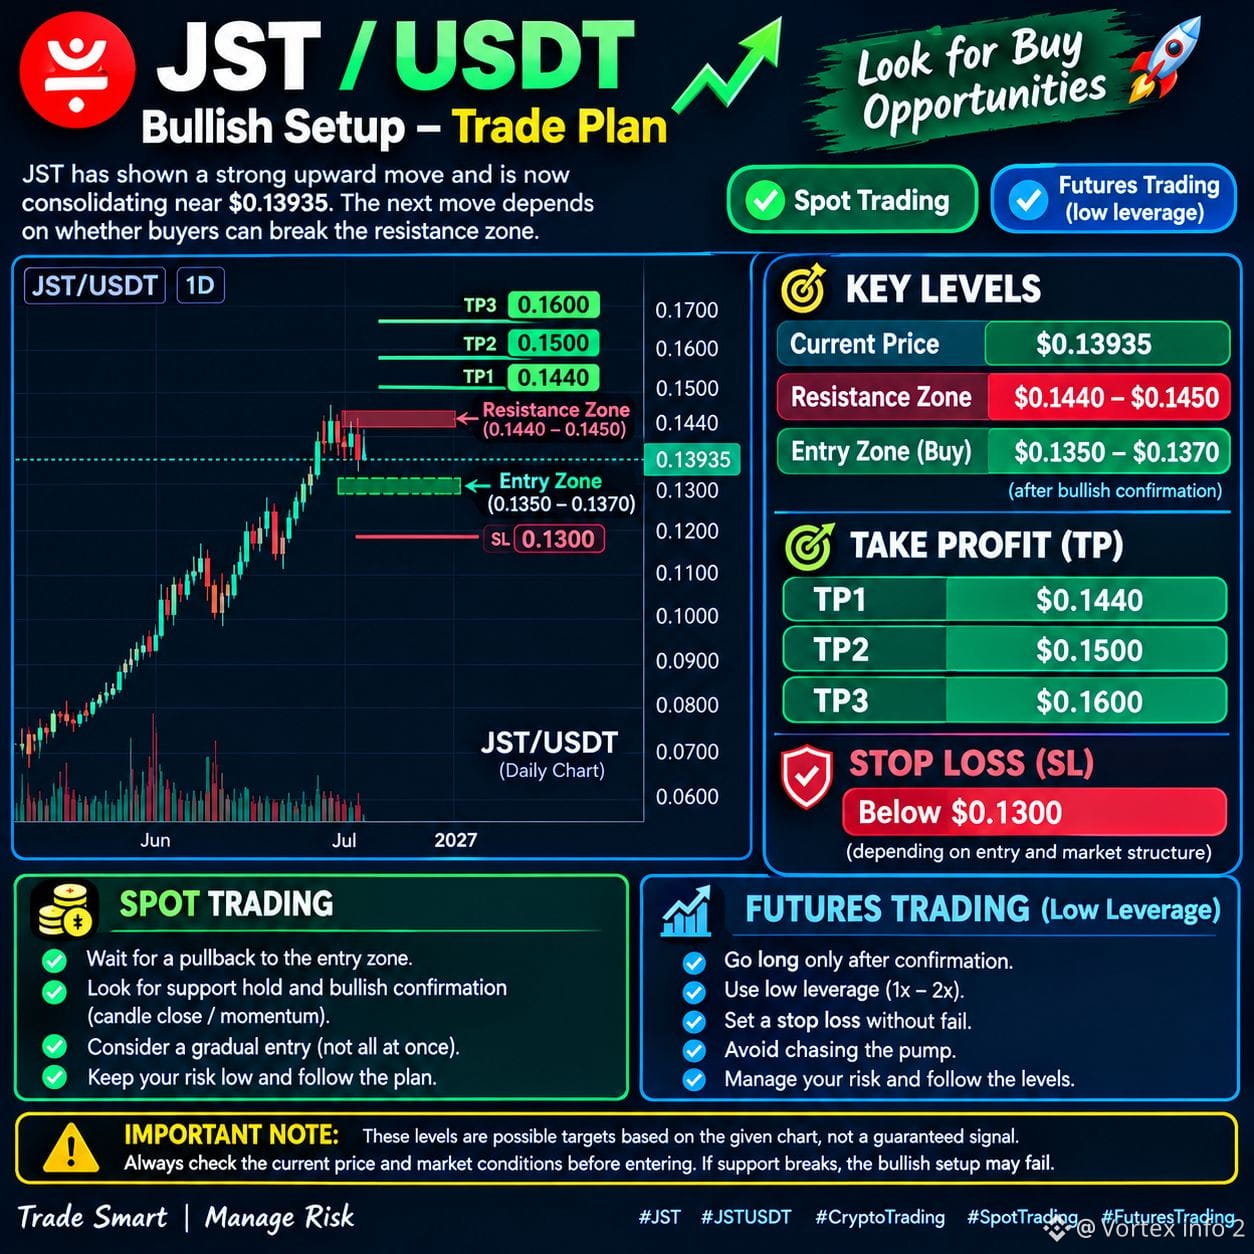
📈$JST JST/USDT — BULLISH WATCHLIST
JST has delivered a strong upside rally and is now consolidating near $0.13935. The next move depends on whether buyers can break the nearby resistance zone.
🔹 Current Price: $0.13935
🔹 Resistance: $0.1440–$0.1450
🔹 Potential Entry Zone: $0.1350–$0.1370, only after bullish confirmation
🔹 TP1: $0.1440
🔹 TP2: $0.1500
🔹 TP3: $0.1600
🔹 Stop-Loss: Below $0.1300, subject to entry and market structure
Spot Strategy: Consider a gradual entry after a confirmed pullback and support hold.$JST
{future}(JSTUSDT)
Futures Strategy: Long only with low leverage (1x–2x), a predefined stop-loss, and confirmation. Avoid chasing the pump.
⚠️ These are tentative technical levels based on the supplied chart, not verified live prices. Confirm the setup before entering. If price loses support, the bullish setup may fail.
#JST #JSTUSDT #CryptoTrading #SpotTrading #FuturesTrading #RiskManagement
📈$JST JST/USDT — BULLISH WATCHLIST
JST has delivered a strong upside rally and is now consolidating near $0.13935. The next move depends on whether buyers can break the nearby resistance zone.
🔹 Current Price: $0.13935
🔹 Resistance: $0.1440–$0.1450
🔹 Potential Entry Zone: $0.1350–$0.1370, only after bullish confirmation
🔹 TP1: $0.1440
🔹 TP2: $0.1500
🔹 TP3: $0.1600
🔹 Stop-Loss: Below $0.1300, subject to entry and market structure
Spot Strategy: Consider a gradual entry after a confirmed pullback and support hold.$JST
Futures Strategy: Long only with low leverage (1x–2x), a predefined stop-loss, and confirmation. Avoid chasing the pump.
⚠️ These are tentative technical levels based on the supplied chart, not verified live prices. Confirm the setup before entering. If price loses support, the bullish setup may fail.
#JST #JSTUSDT #CryptoTrading #SpotTrading #FuturesTrading #RiskManagement
1
155
·
--
Bullish
🔥 THE CRYPTO MARKET IS HEATING UP! 🚀
💰 BTC vs BNB vs ZEC vs ETH — Which Coin Is Worth Watching?
📊 Current Market Snapshot: 🔸 BTC: $79,894.43 (-1.21%) 🔸 BNB: $739.79 (-0.92%) 🔸 ZEC: $1,197.52 (-1.52%) 🔸 ETH: Price needs a fresh update.
📉 The market is showing selling pressure, but the next move could bring new opportunities.
👑 BTC remains the key market to watch. If Bitcoin stabilizes and buyers step in, we could see a recoverd$BTC attempt. However, if selling pressure continues, further downside remains possible.
⚡ BNB is showing comparatively less downside among the three coins with provided prices.$ETH
🔥 ZEC has a larger percentage decline, making its next price action worth monitoring closely.$ZEC
🎯 My Strategy: Watch key support and resistance levels,$BNB wait for confirmation, and avoid entering trades based on emotions alone.
💬 Your Turn! Which coin has caught your attention right now — $BTC, $BNB, $ZEC, or $ETH? And why?
👇 Share your market view in the comments!
#CryptoMarket #Bitcoin #ZEC #CryptoTrading #MarketAnalysis
🔥 THE CRYPTO MARKET IS HEATING UP! 🚀
💰 BTC vs BNB vs ZEC vs ETH — Which Coin Is Worth Watching?
📊 Current Market Snapshot: 🔸 BTC: $79,894.43 (-1.21%) 🔸 BNB: $739.79 (-0.92%) 🔸 ZEC: $1,197.52 (-1.52%) 🔸 ETH: Price needs a fresh update.
📉 The market is showing selling pressure, but the next move could bring new opportunities.
👑 BTC remains the key market to watch. If Bitcoin stabilizes and buyers step in, we could see a recoverd$BTC attempt. However, if selling pressure continues, further downside remains possible.
⚡ BNB is showing comparatively less downside among the three coins with provided prices.$ETH
🔥 ZEC has a larger percentage decline, making its next price action worth monitoring closely.$ZEC
🎯 My Strategy: Watch key support and resistance levels,$BNB wait for confirmation, and avoid entering trades based on emotions alone.
💬 Your Turn! Which coin has caught your attention right now — $BTC , $BNB, $ZEC , or $ETH ? And why?
👇 Share your market view in the comments!
#CryptoMarket #Bitcoin #ZEC #CryptoTrading #MarketAnalysis

2
237
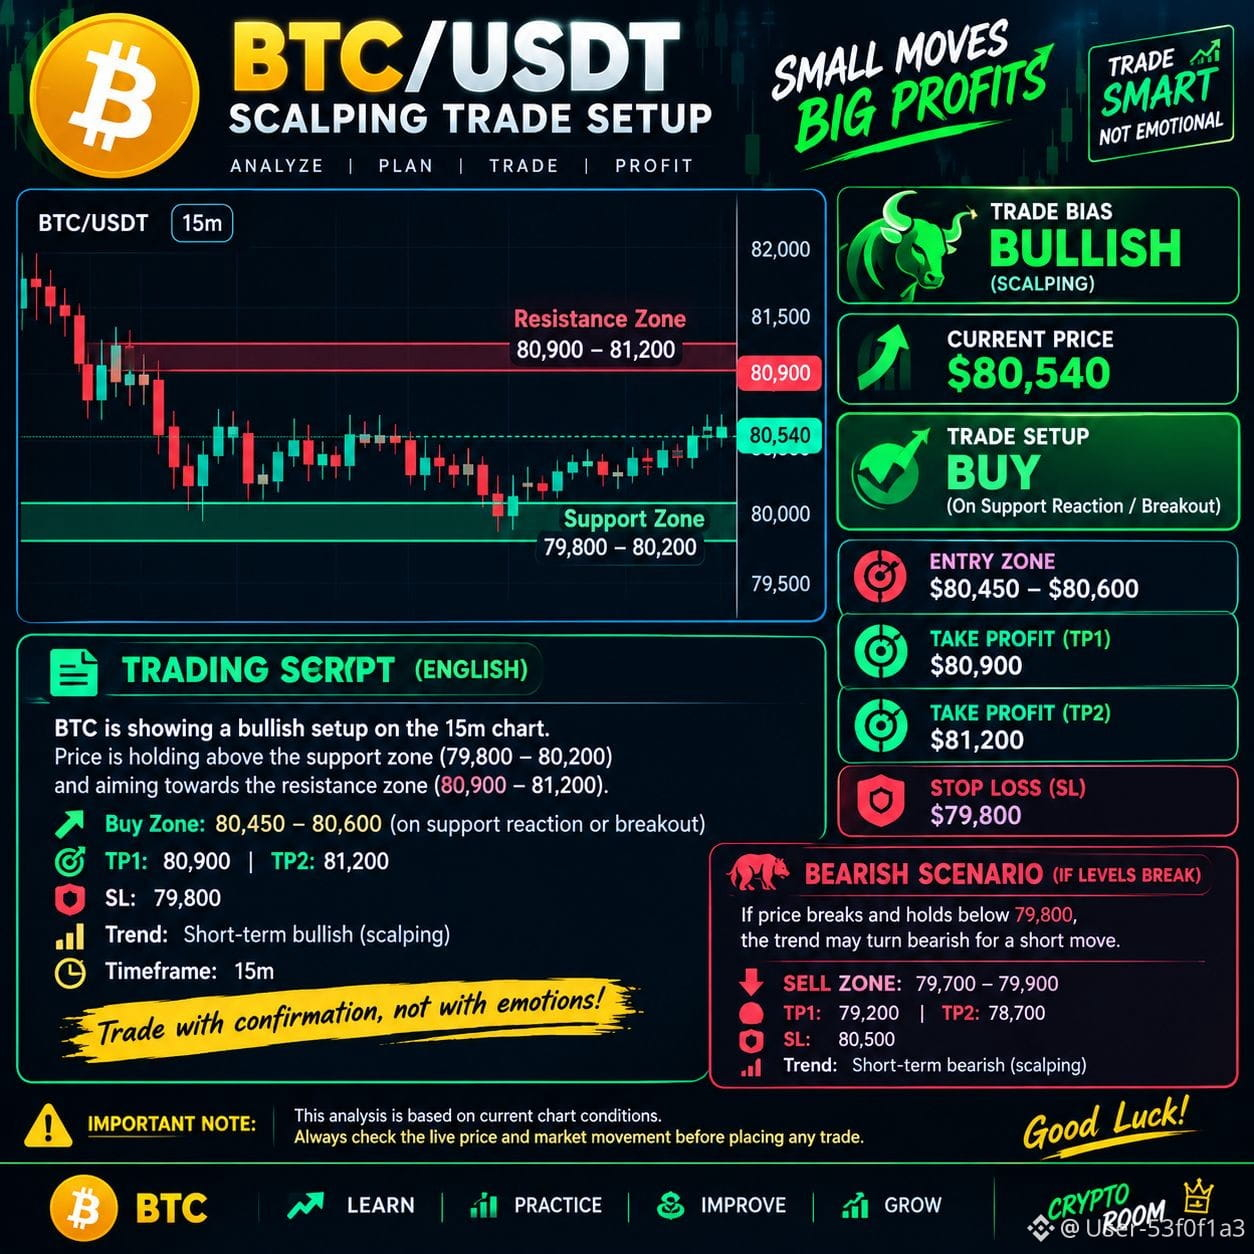
📈 BTC/USDT — BULLISH SCALPING SETUP
Timeframe: 15 Minutes
Market Bias: Short-Term Bullish (Conditional)
🟢 BUY ZONE: $80,450–$80,600
🎯 TP1: $81,200
🎯 TP2: $81,500
🛑 Stop Loss: $79,800
Trading Instructions:$BTC
- Wait for bullish candle confirmation inside the buy zone.
- Consider a BUY only if price action confirms support or a breakout above $80,600.
- Consider partial profit near TP1; reassess before holding for TP2.
- If price breaks below $79,800, the bullish setup is invalidated.
⚠️ Risk Warning: These levels are illustrative and based on the earlier chart, not verified live market data. Confirm current price and levels before trading.
Trade Smart. Manage Risk. Stay Disciplined.#$BTC
{spot}(BTCUSDT)
📈 BTC/USDT — BULLISH SCALPING SETUP
Timeframe: 15 Minutes
Market Bias: Short-Term Bullish (Conditional)
🟢 BUY ZONE: $80,450–$80,600
🎯 TP1: $81,200
🎯 TP2: $81,500
🛑 Stop Loss: $79,800
Trading Instructions:$BTC
- Wait for bullish candle confirmation inside the buy zone.
- Consider a BUY only if price action confirms support or a breakout above $80,600.
- Consider partial profit near TP1; reassess before holding for TP2.
- If price breaks below $79,800, the bullish setup is invalidated.
⚠️ Risk Warning: These levels are illustrative and based on the earlier chart, not verified live market data. Confirm current price and levels before trading.
Trade Smart. Manage Risk. Stay Disciplined.#$BTC
1
2
195
·
--
Bullish
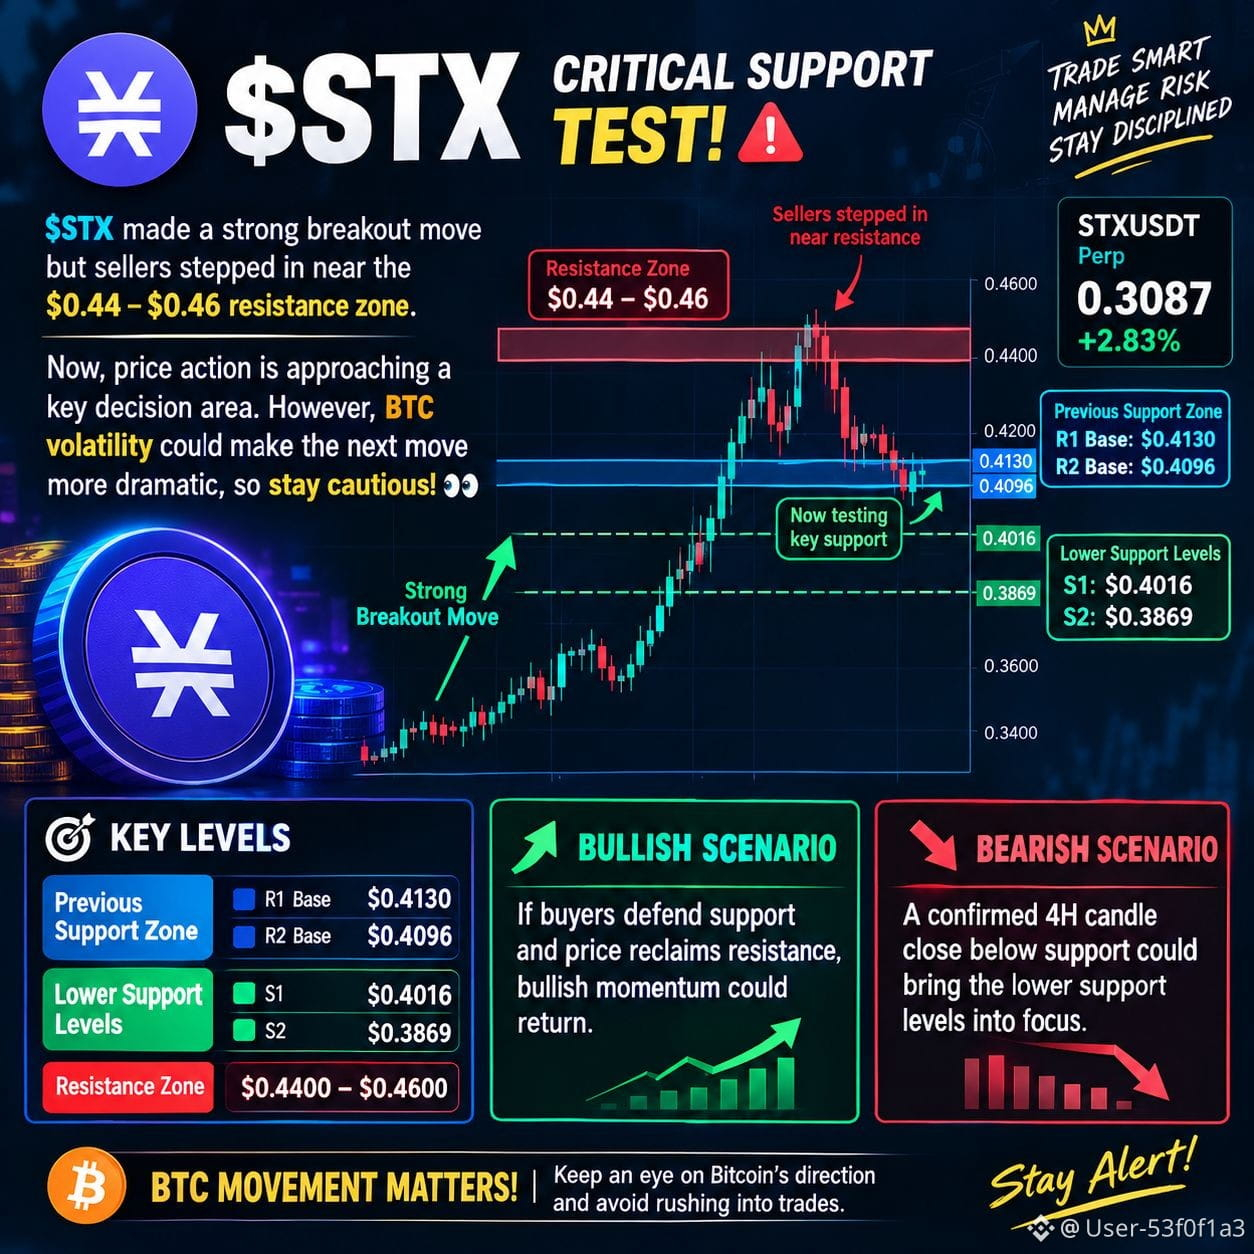
📊 $STX — Critical Support Test! ⚠️
$STX made a strong breakout move, but sellers stepped in near the $0.44–$0.46 resistance zone. $STX
Now, price action is approaching a key decision area. However, BTC volatility could make the next move more dramatic, so stay cautious! 👀... $STX
🔹 Previous Support Zone
• R1 Base: $0.4130
• R2 Base: $0.4096
🔻 Lower Support Levels
• S1: $0.4016
• S2: $0.3869
🔺 Major Resistance
• $0.4400 – $0.4600
📈 Bullish Scenario: If buyers defend support and price reclaims resistance, bullish momentum could return..
📉 Bearish Scenario: A confirmed 4H candle close below support could bring the lower support levels into focus#.$STX
1
2
136
Log in to explore more content
Join global crypto users on Binance Square
⚡️ Get latest and useful information about crypto.
💬 Trusted by the world’s largest crypto exchange.
👍 Discover real insights from verified creators.
Email / Phone number