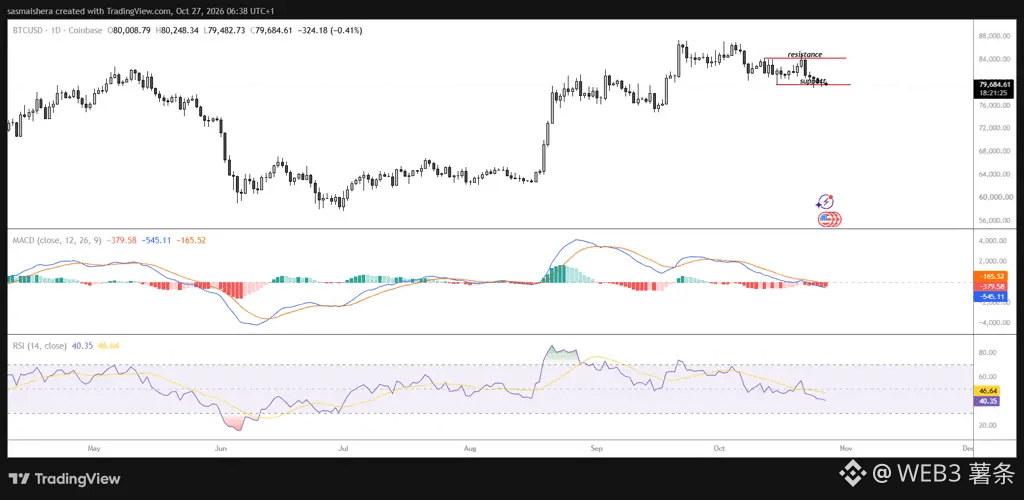
#比特币 The daily chart shows mixed signals. The current price remains above the 100-day moving average at $77,691 and the 200-day moving average at $76,306, indicating some support below. However, the price has yet to break above the 50-day moving average at $80,816, so the rebound still faces pressure.
Technical indicators show an RSI of 40, suggesting weak buying pressure. The MACD also remains below the zero line, indicating that the short-term outlook has yet to improve significantly.
Key price levels to watch:
Resistance: $80,816. If the price breaks above this level decisively, the next level to watch is around $85,000.
Support: $77,691 and $76,306. If the price continues to fall, these two levels may provide important support.