

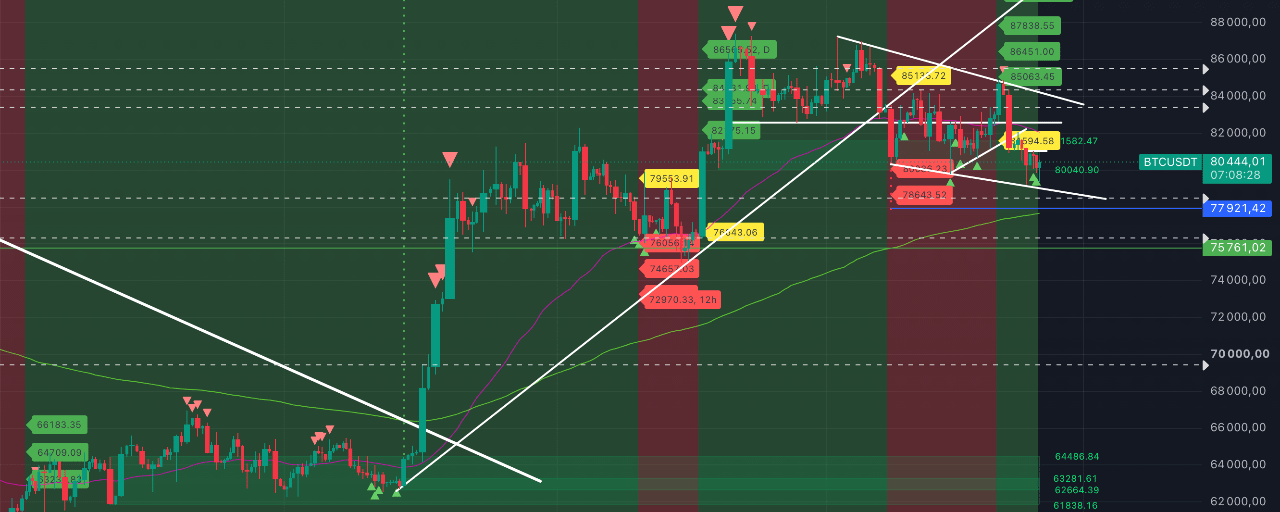


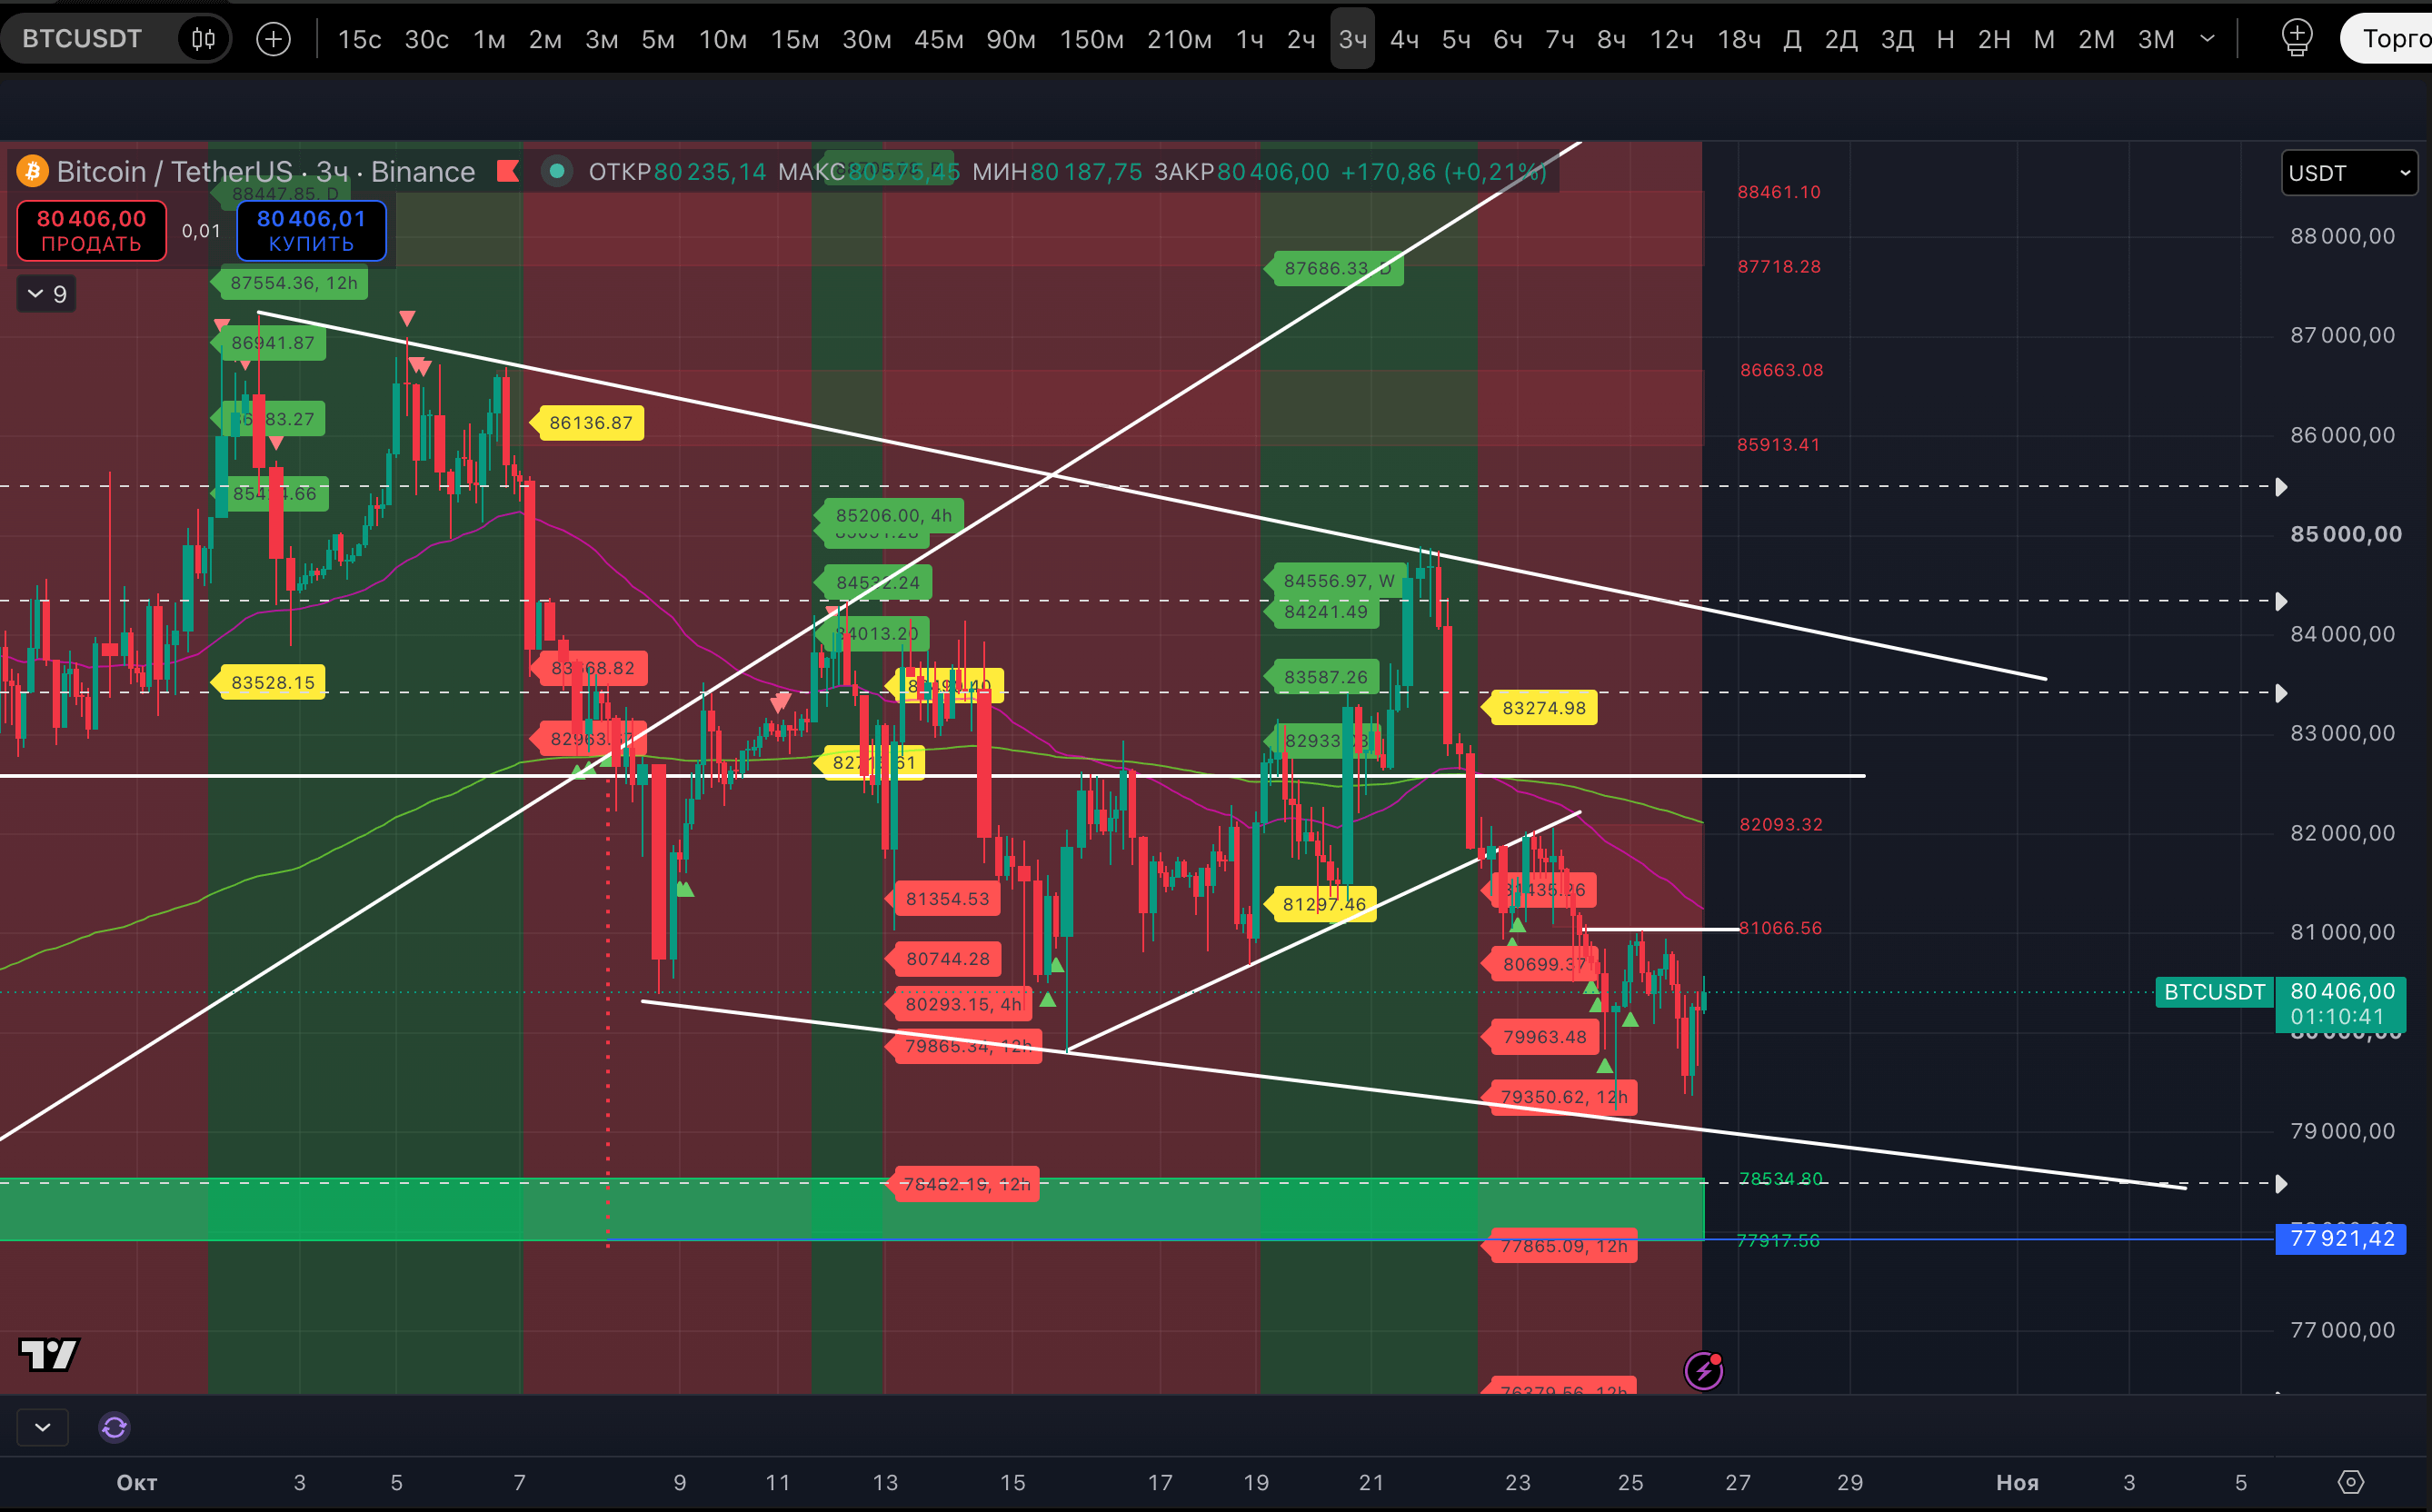
Starting today, the BTC price may make a new attempt to rise. At least, this is suggested by the potential low markers that appeared yesterday on the 12- and 18-hour timeframes (with the uptrend on the 18-hour timeframe remaining intact), while liquidity zones on these timeframes continue to provide support.
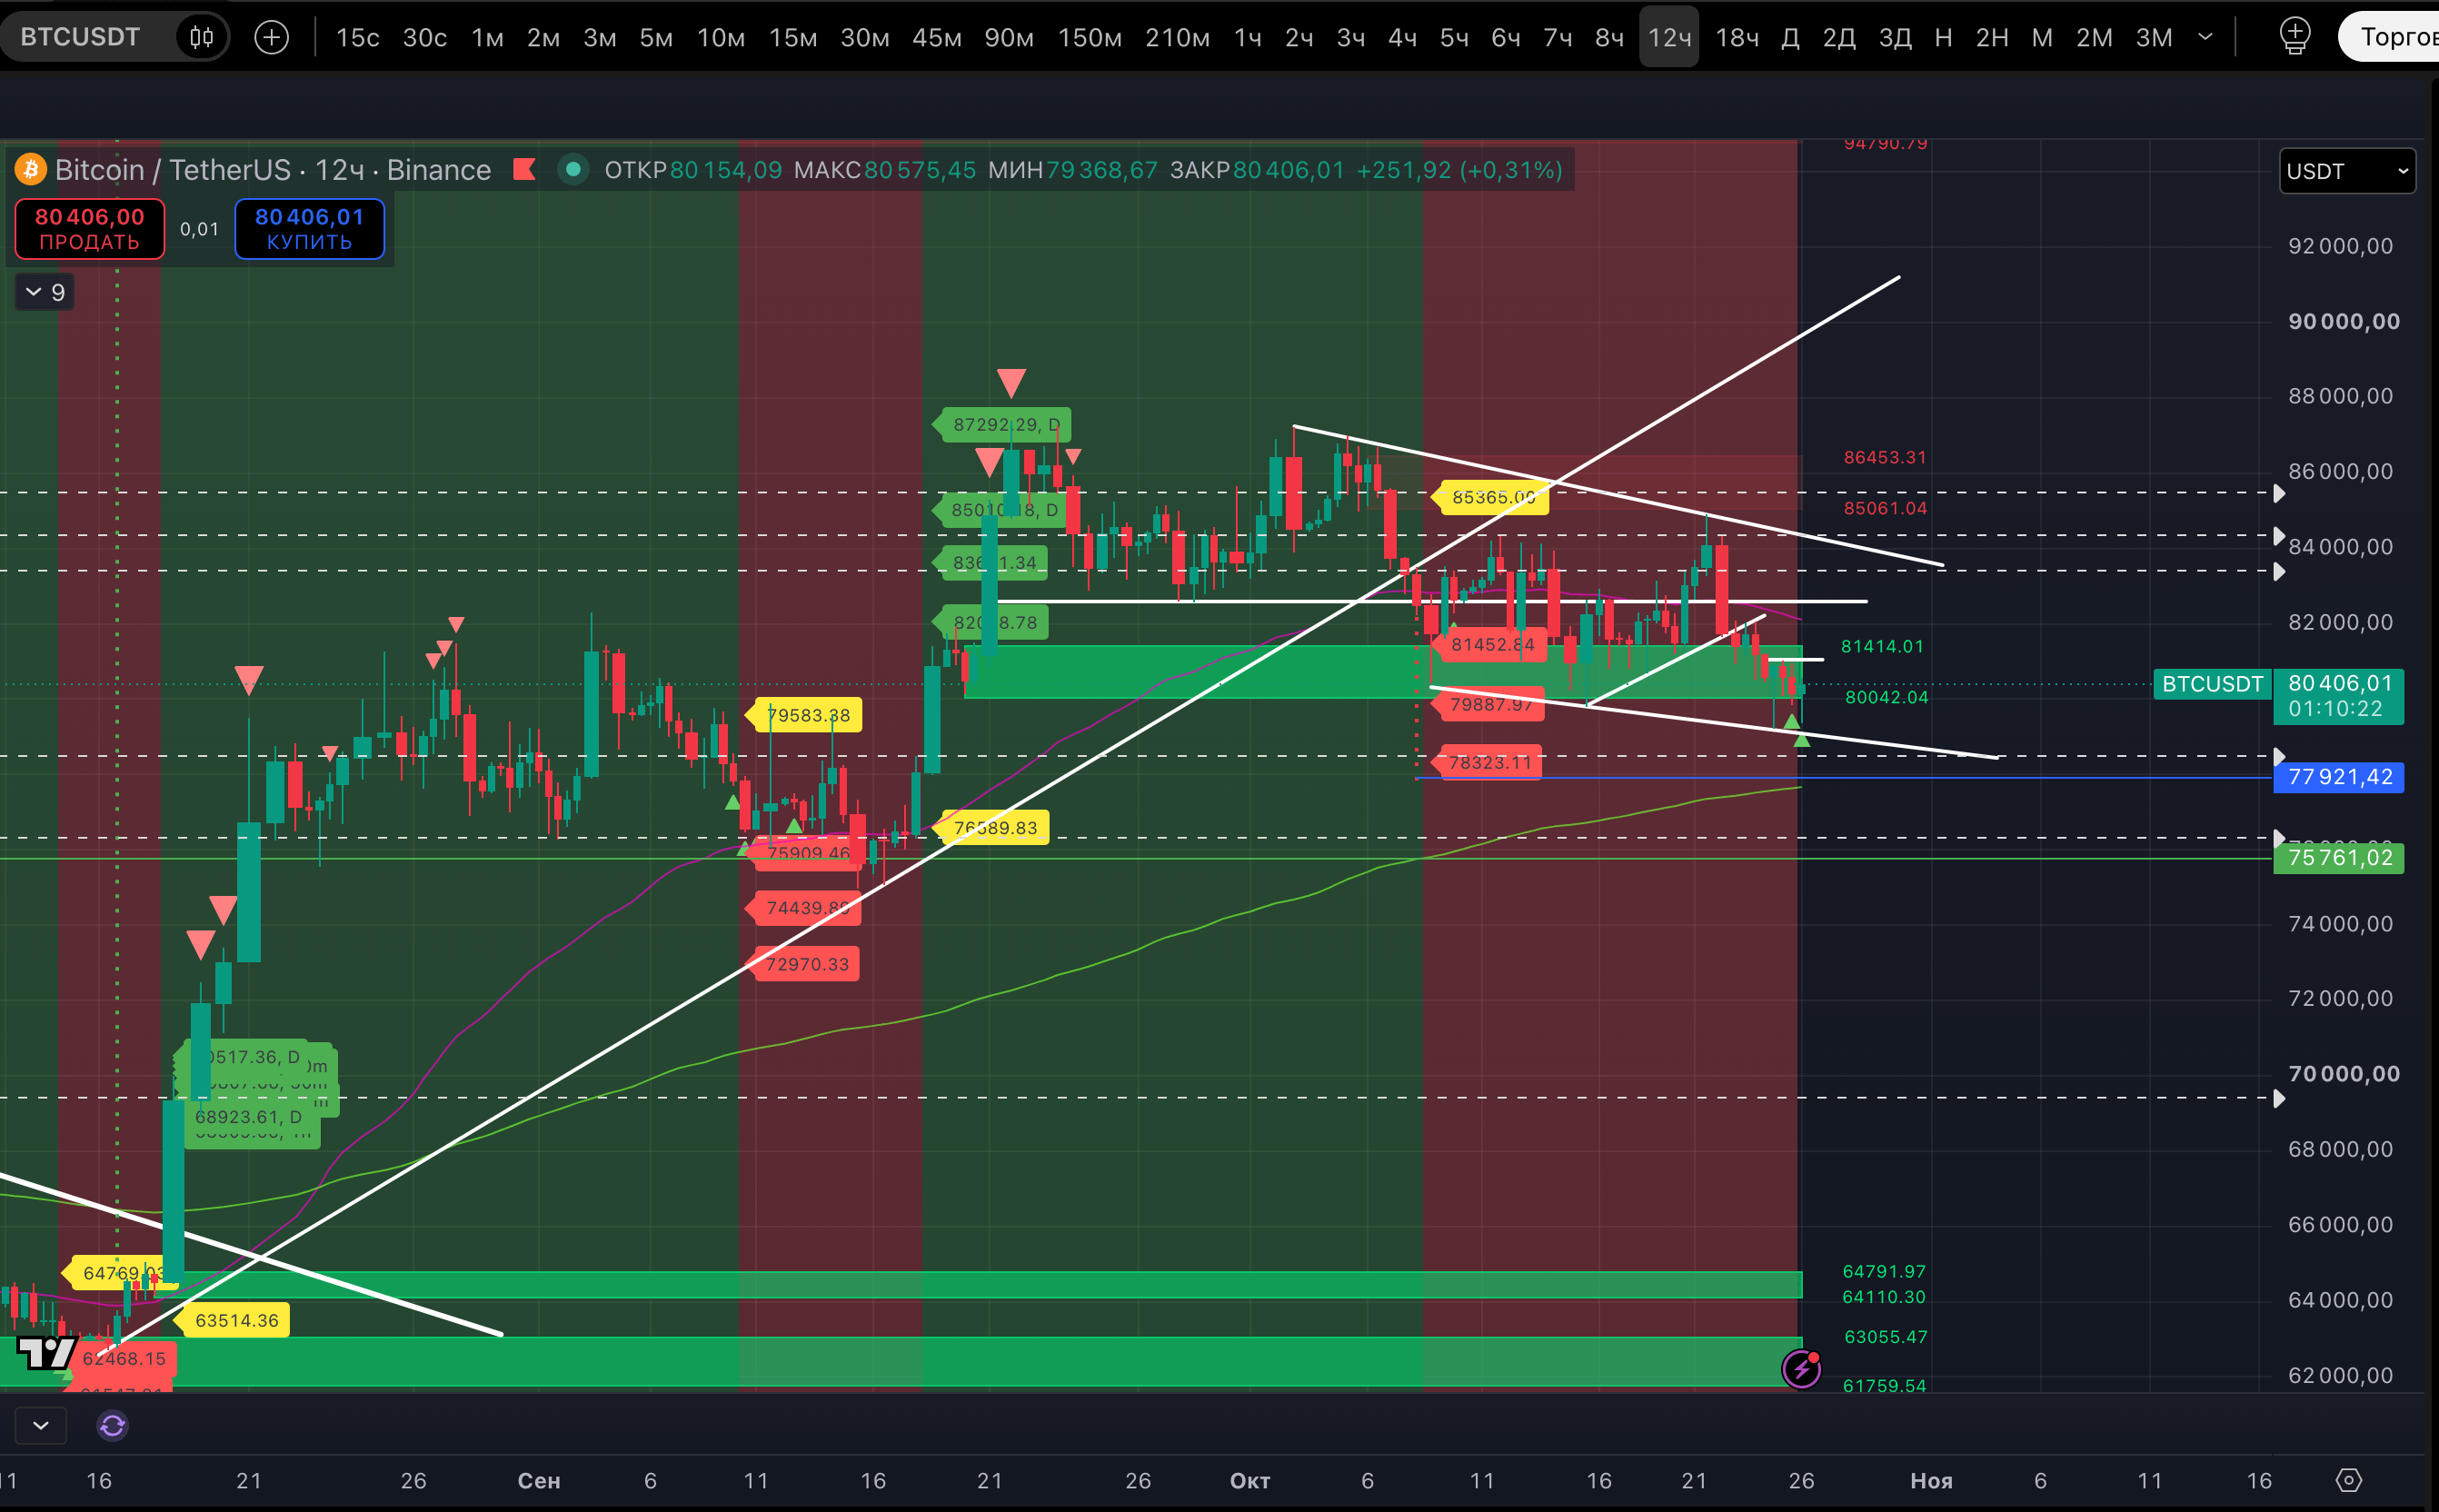
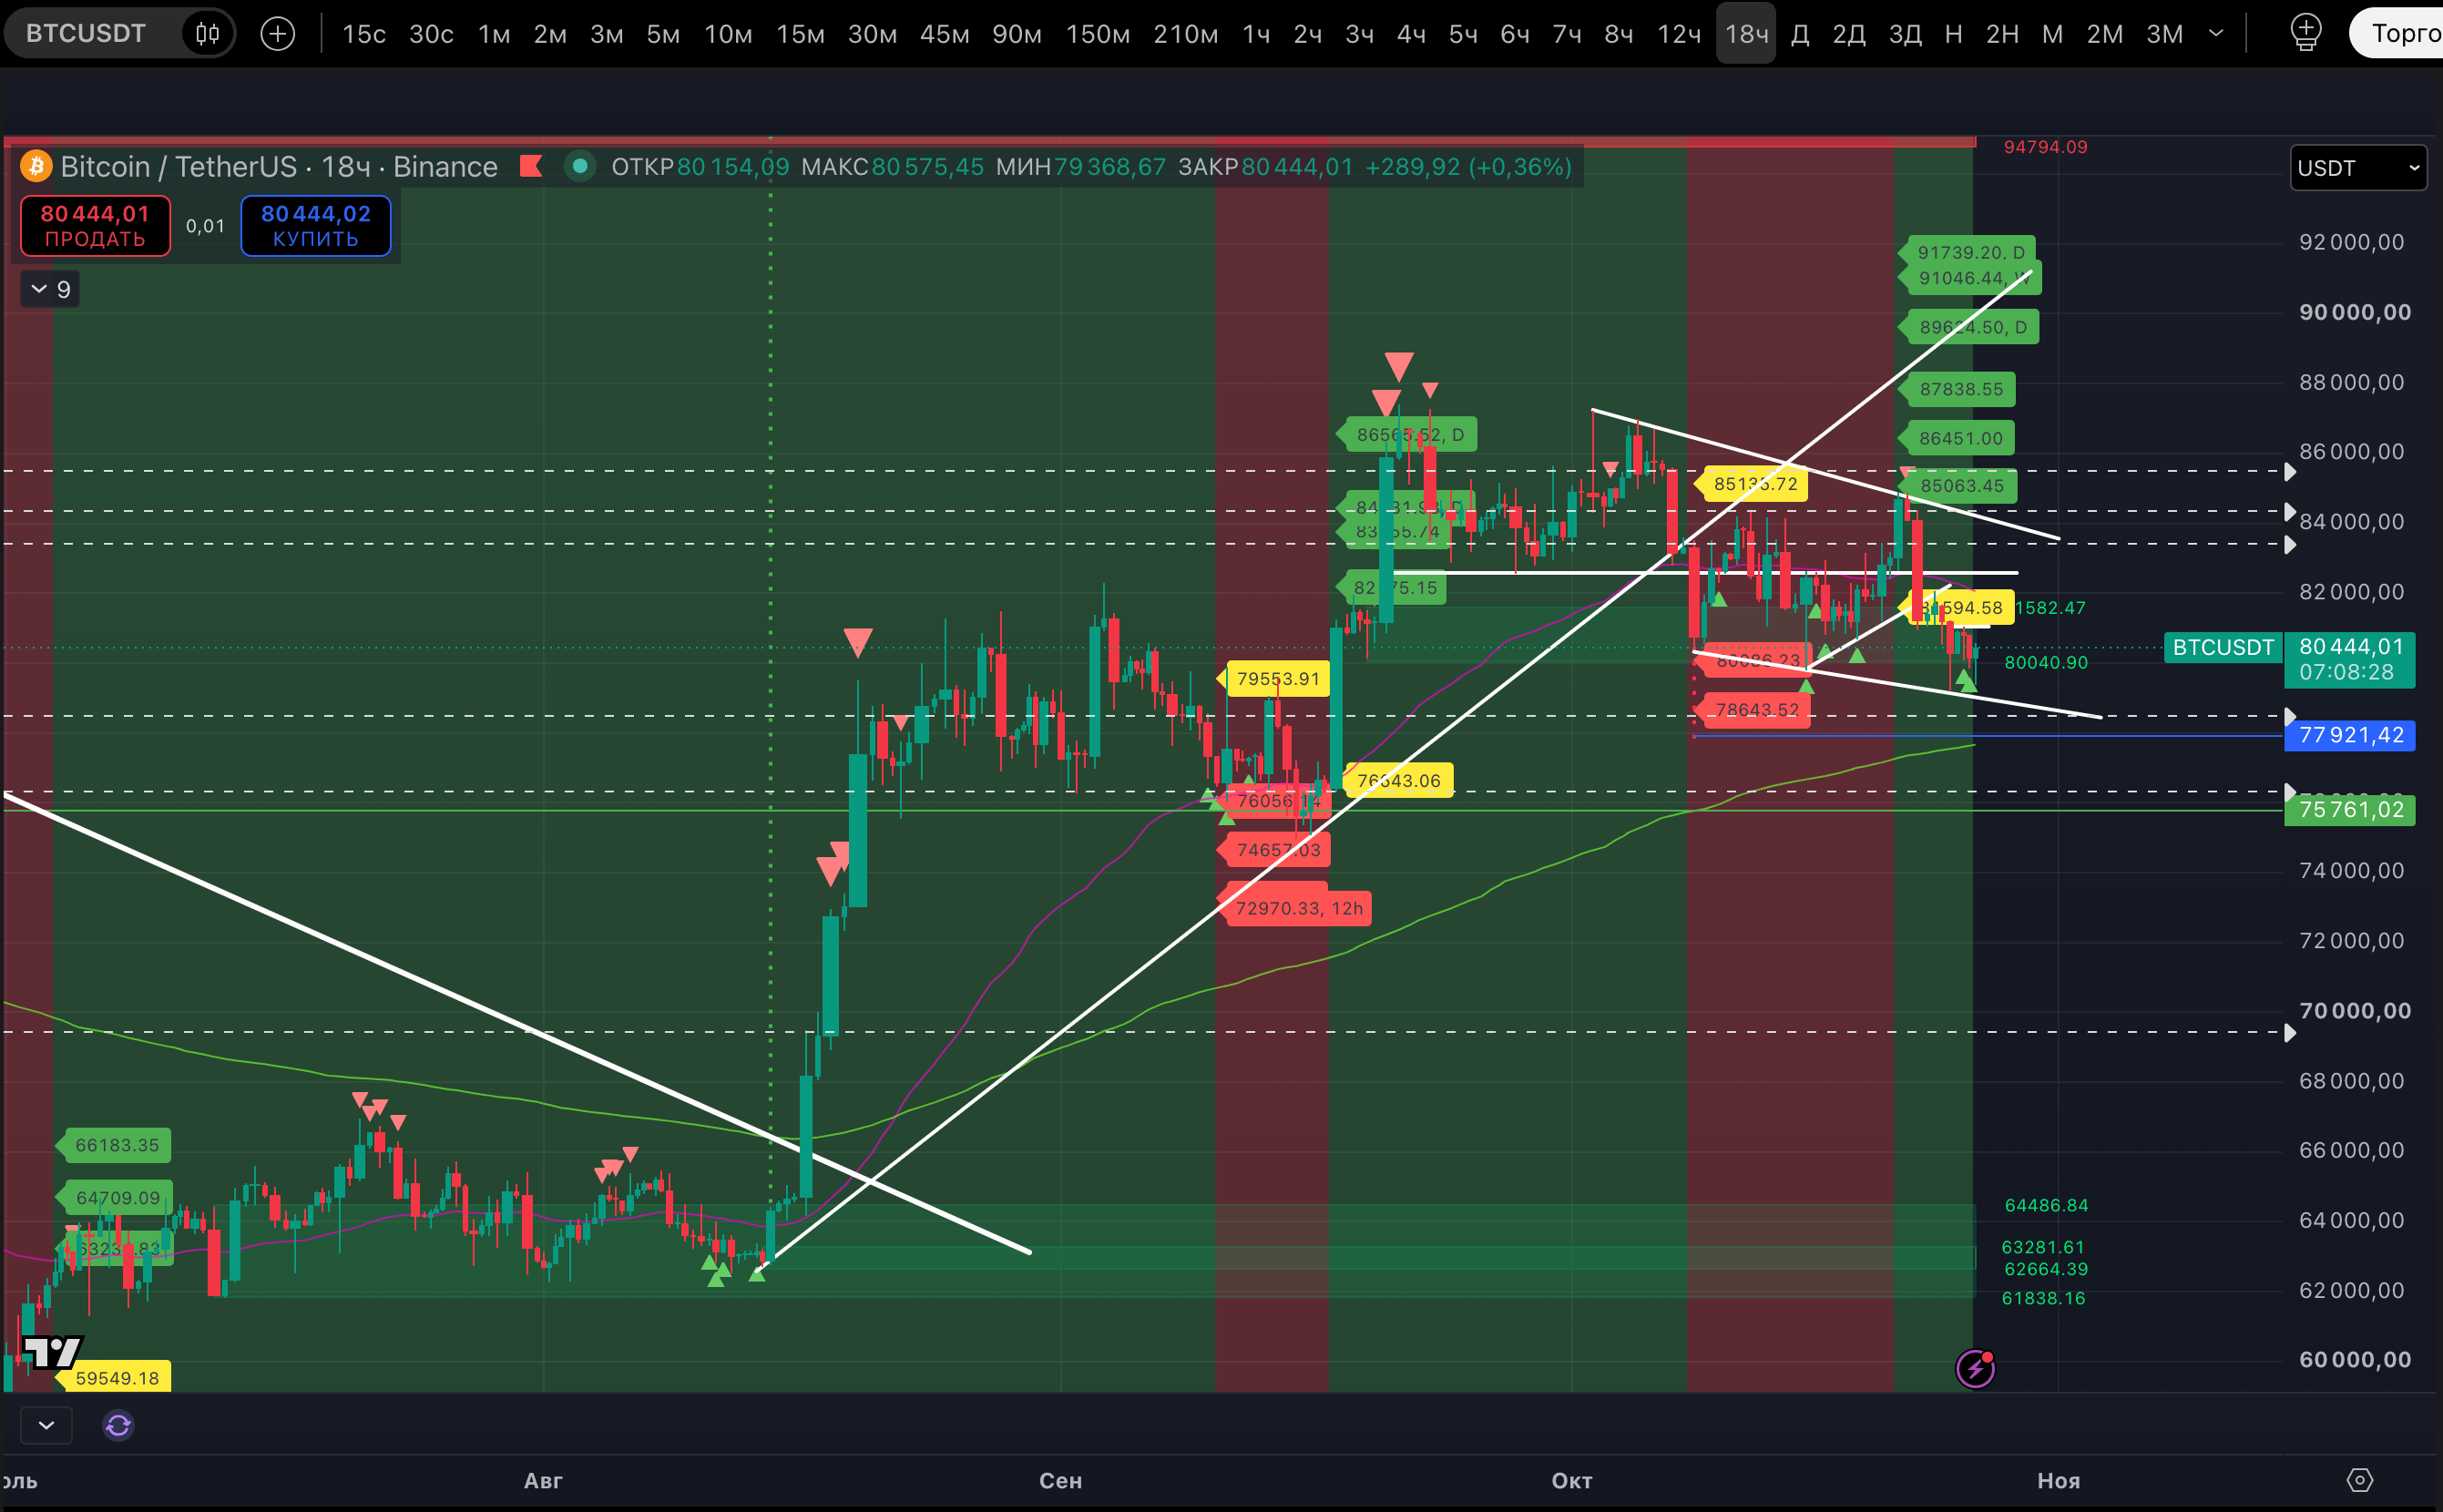
Just the day before yesterday, we wrote:
"...it is also worth noting the liquidity zones on the 12- and 18-hour timeframes: $80,042–$81,414 and, respectively, the similar $80,040–$81,582 zones. They have kept momentum bearish since October 8 and have stopped sellers’ advances several times. But remember: the more often a level or liquidity zone is tested, the more likely it is to break. To invalidate these zones, the 12-hour candle must close below $80,042, and the 18-hour candle below $80,040."
In the local #BTC picture, the chart has possibly been forming a “Double Bottom” since Saturday, but we can only confirm it after a breakout above the “neckline” at $81,033. If it breaks above that level and the pattern starts to play out, the full target would be around $82,800.
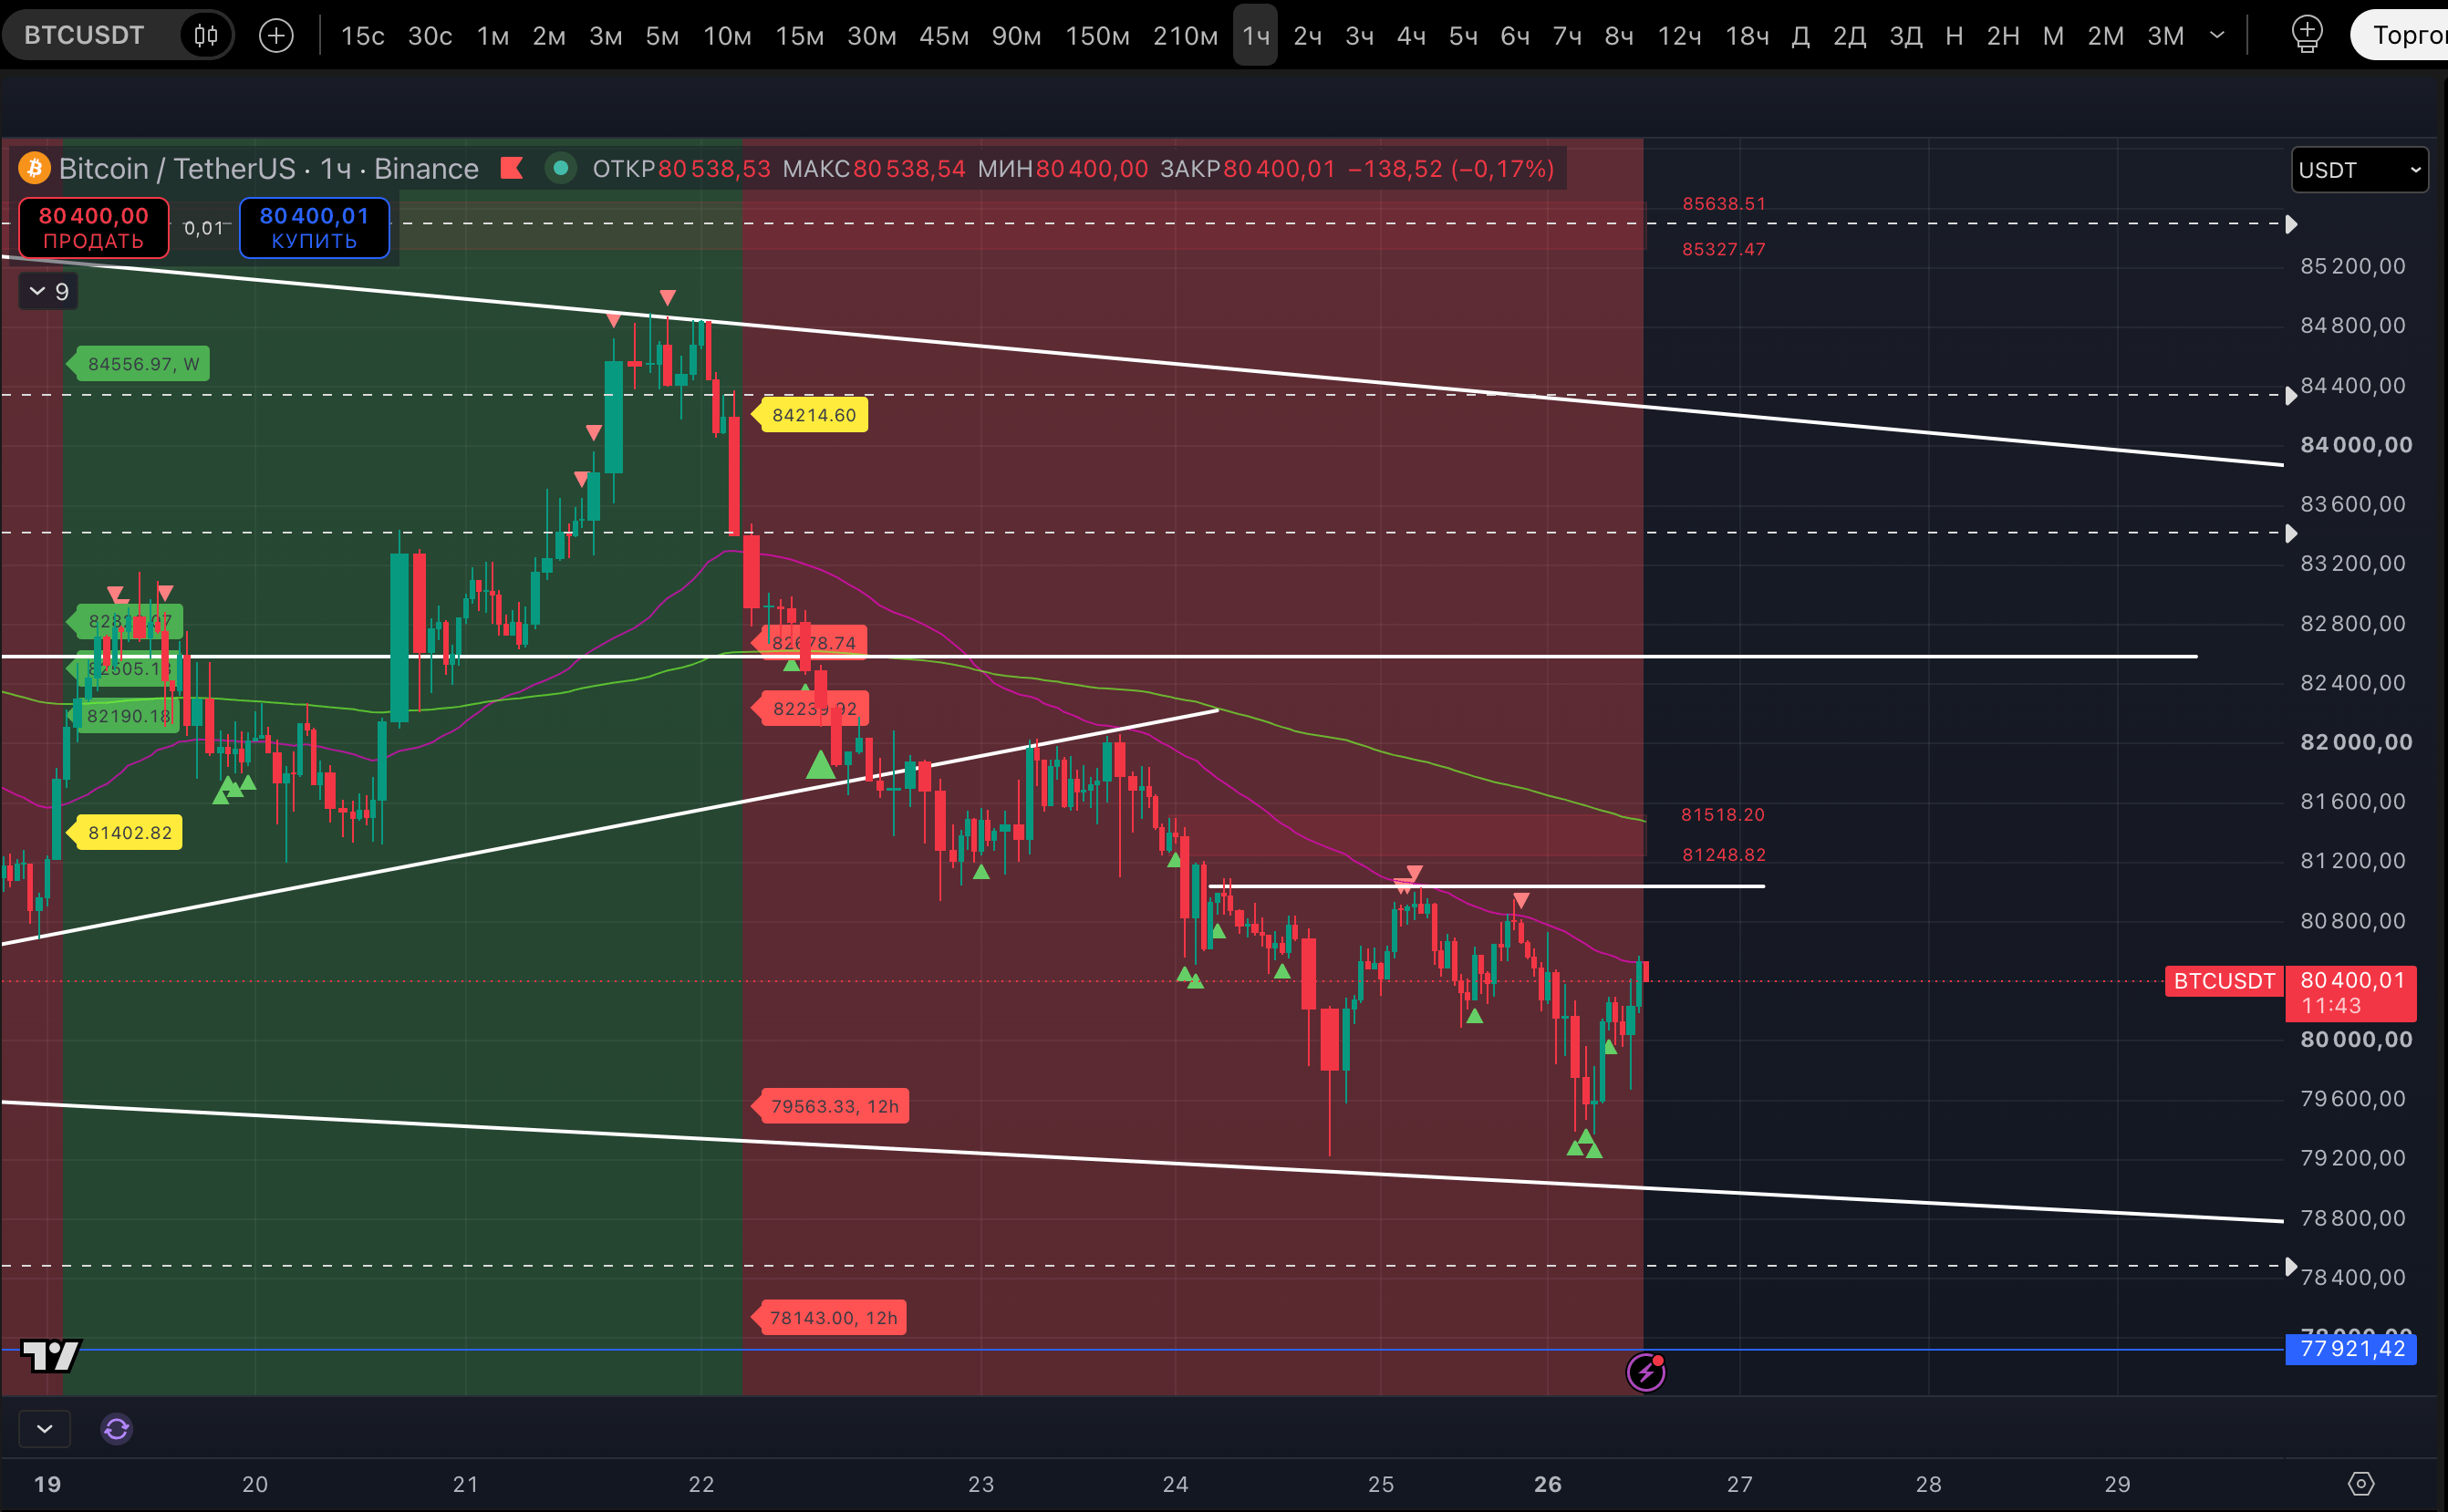
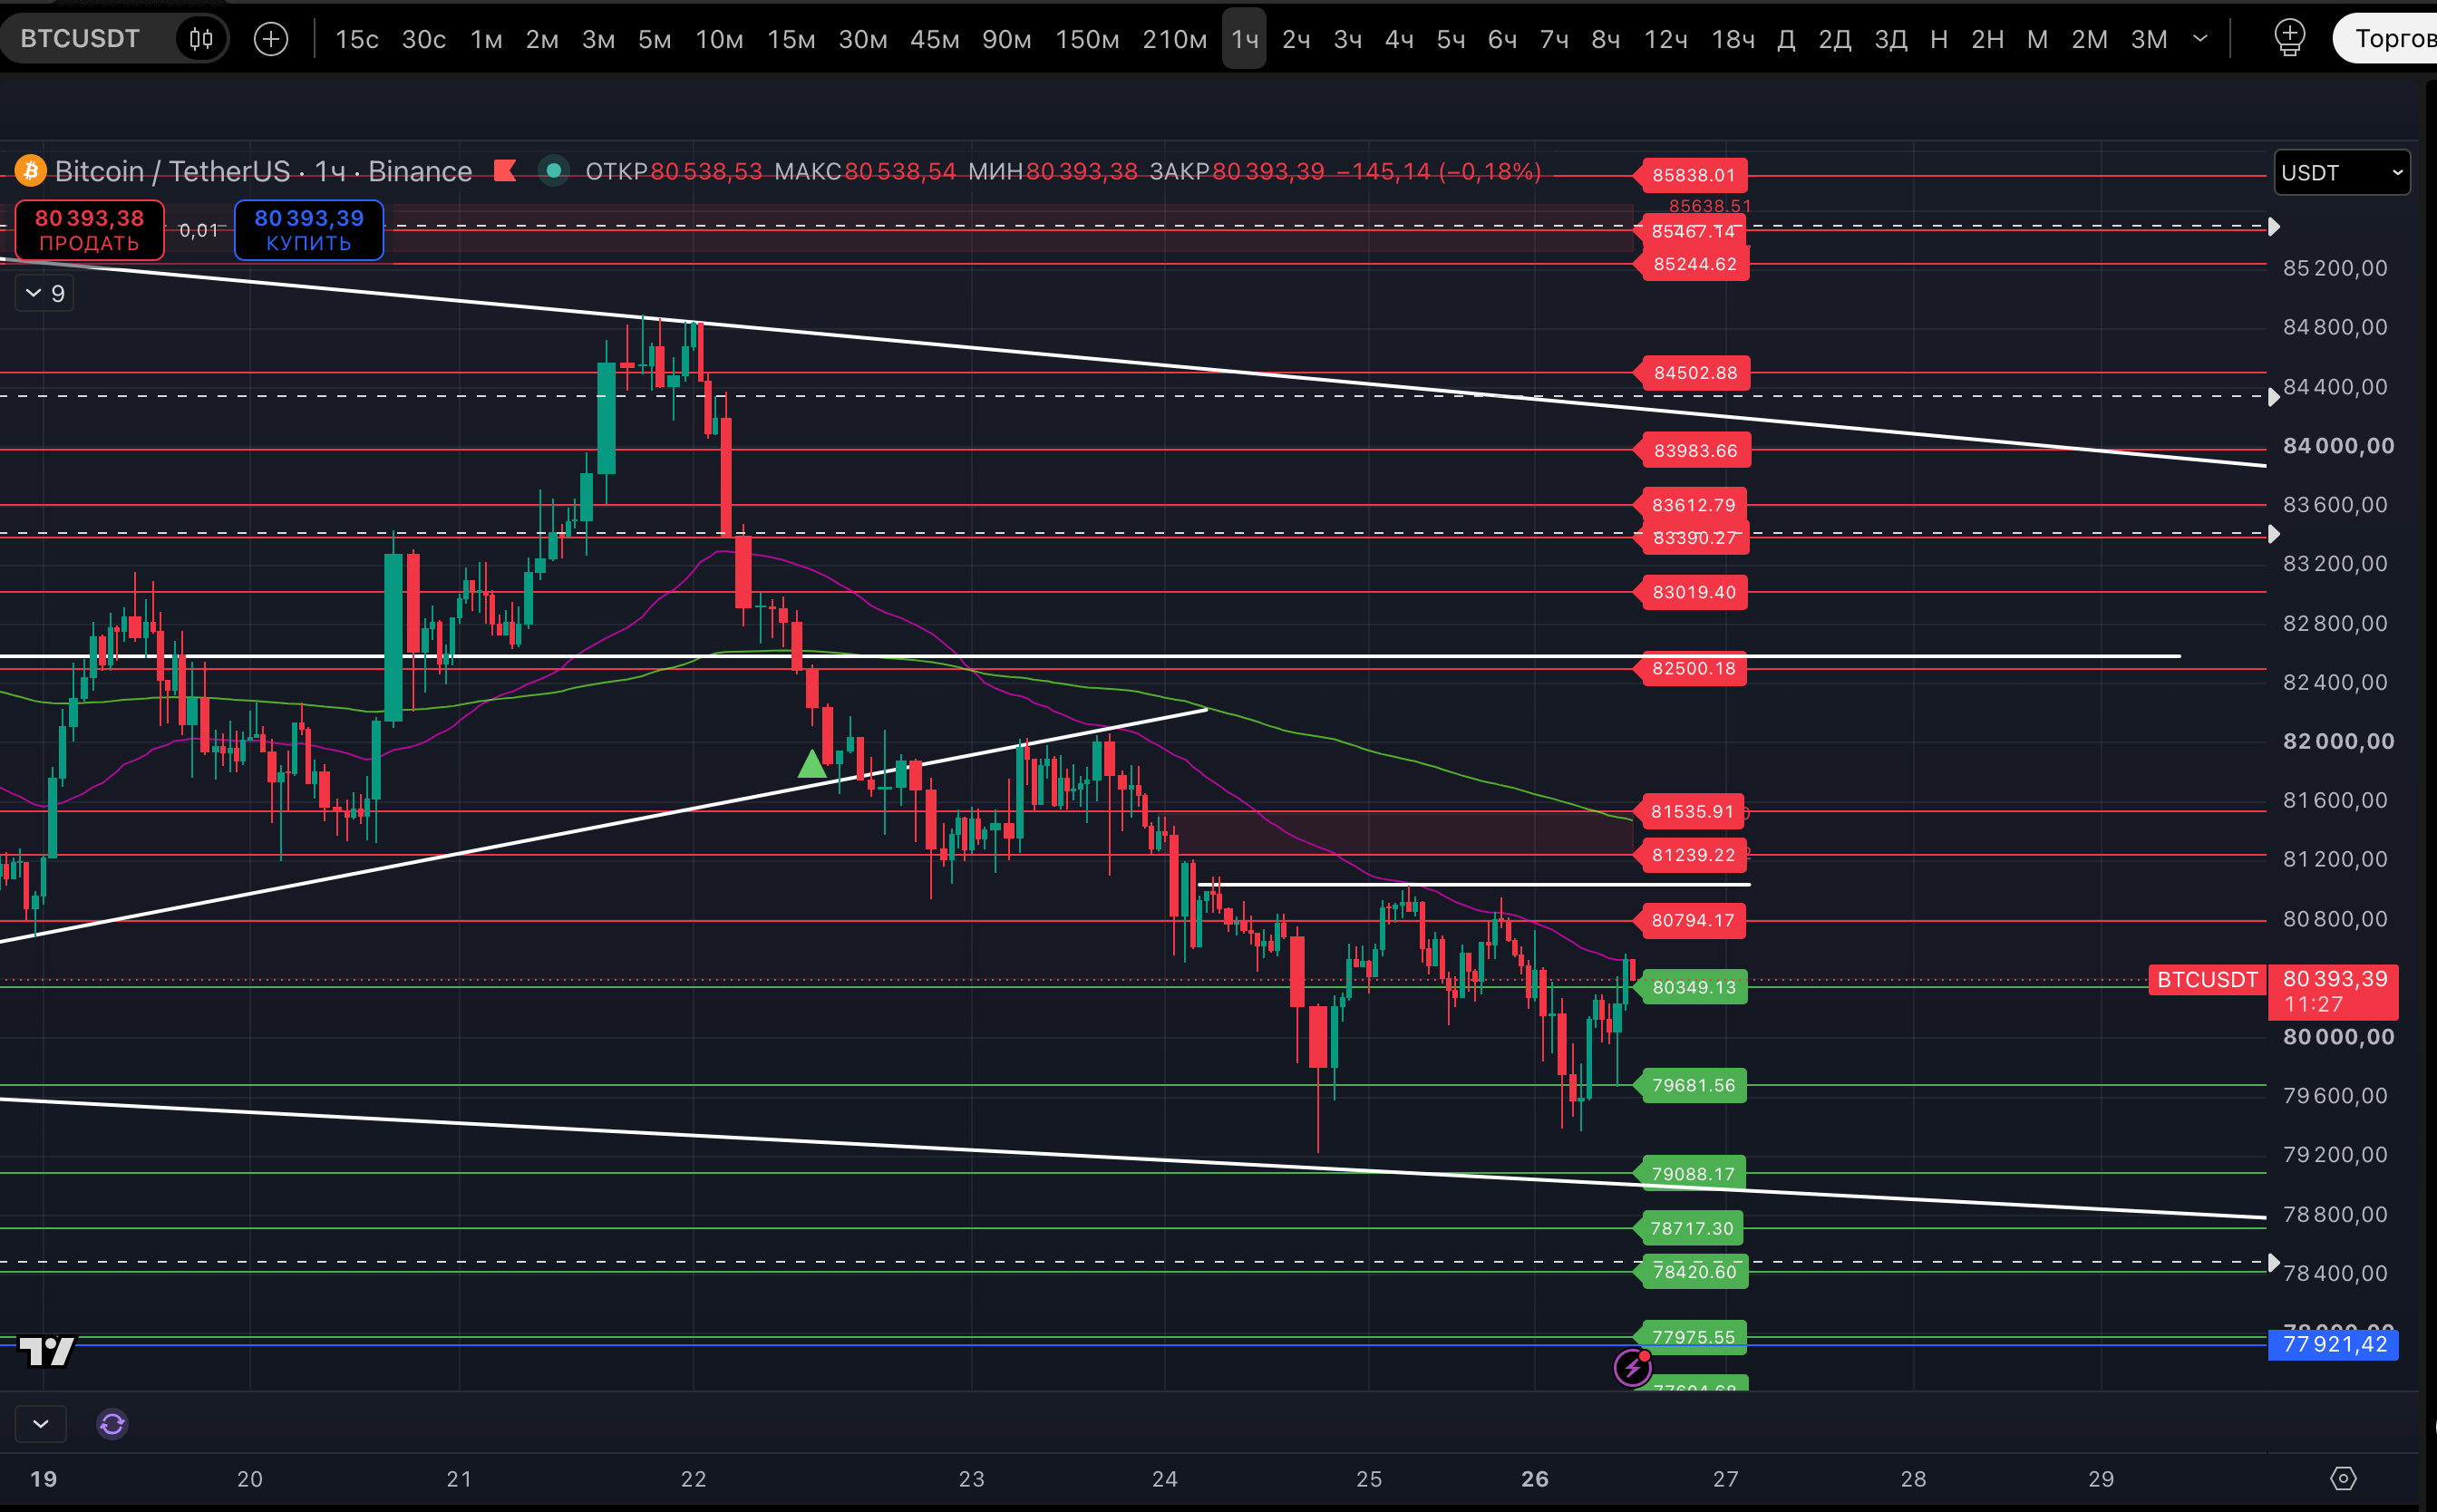
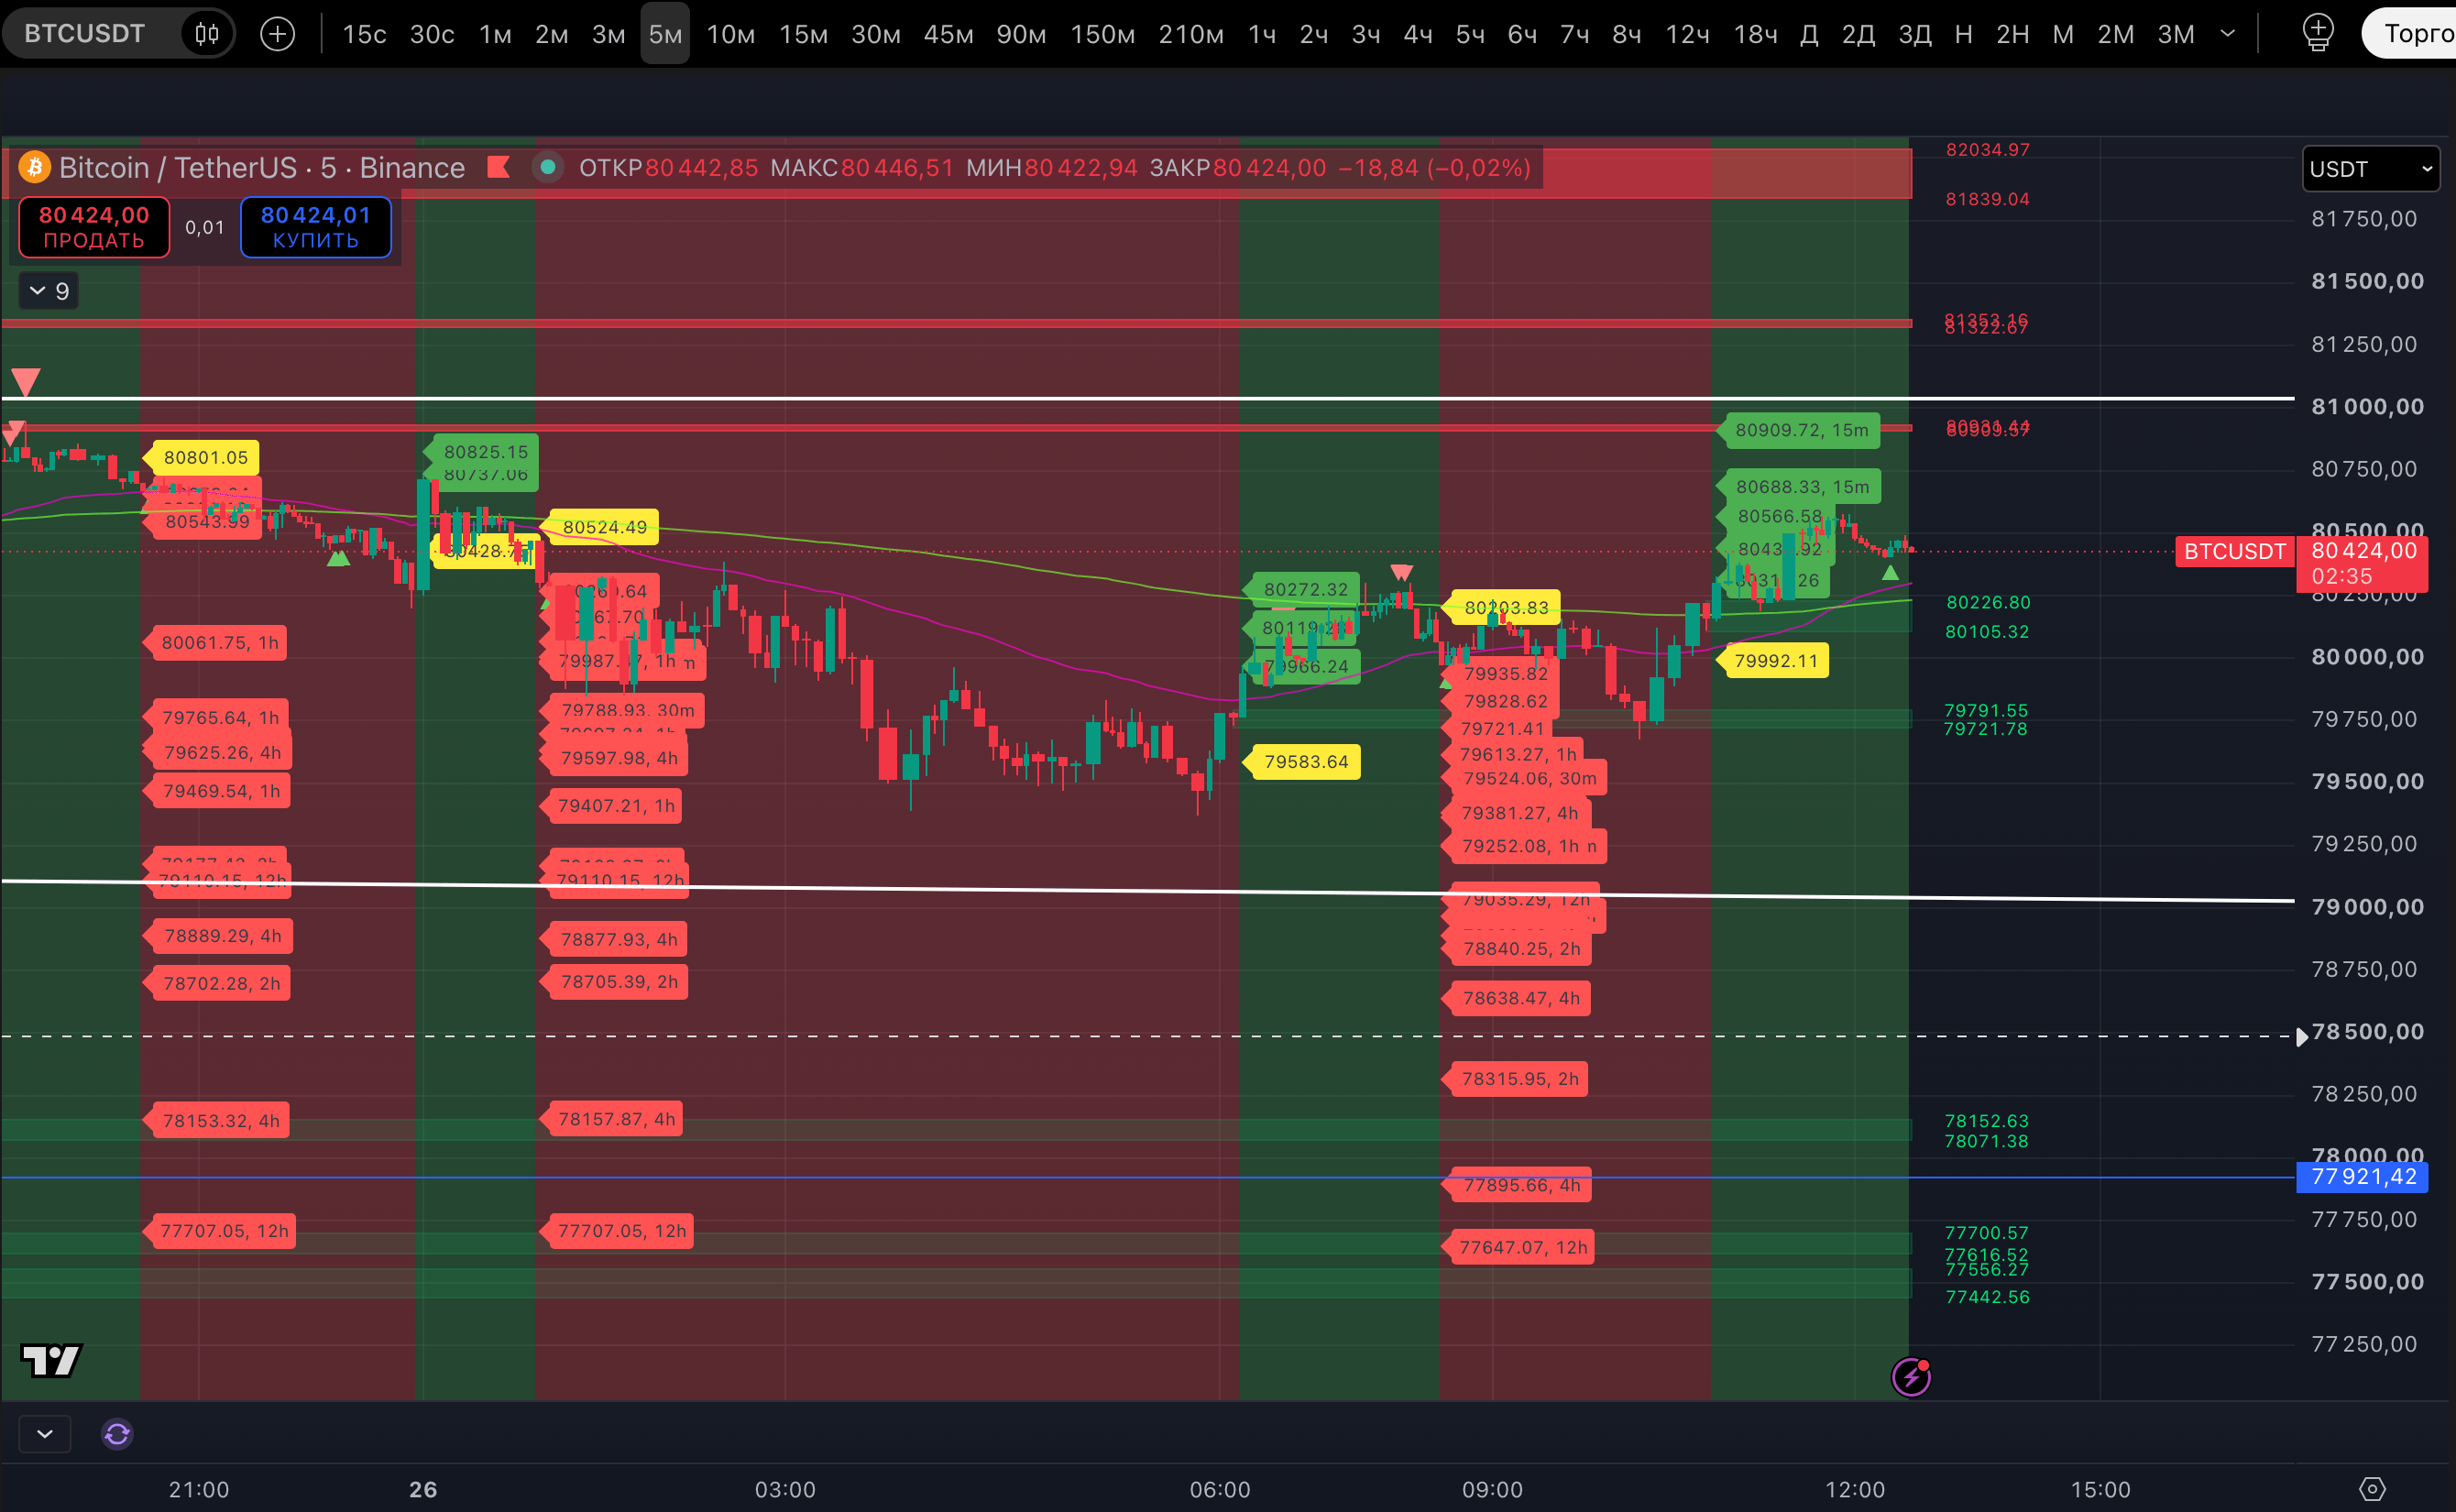
Until then, the situation remains contradictory. Despite the uptrend on the 18-hour timeframe, the price remains in a strong downtrend on the 3-hour timeframe, meaning the outlook for local speculation is bearish. Plus, on the lower 5-minute timeframe, each new downtrend shows a considerable concentration of targets below. This could lead to a squeeze down to $79,252 in a conservative scenario, $78,638 in a neutral one, and $77,647 in the most extreme scenario.
Let’s see what happens first: an uptrend on the 3-hour timeframe or a downtrend on the 18-hour timeframe.
____________
VOTE FOR “PROJECT 73” IN THE “BEST LONG-FORM AUTHOR” CATEGORY AT BINANCE THE BLOCKCHAIN 100 - 2026 - https://www.binance.com/ru-UA/square/blockchain-100-2026?username=431 (you can now cast your vote once every day).