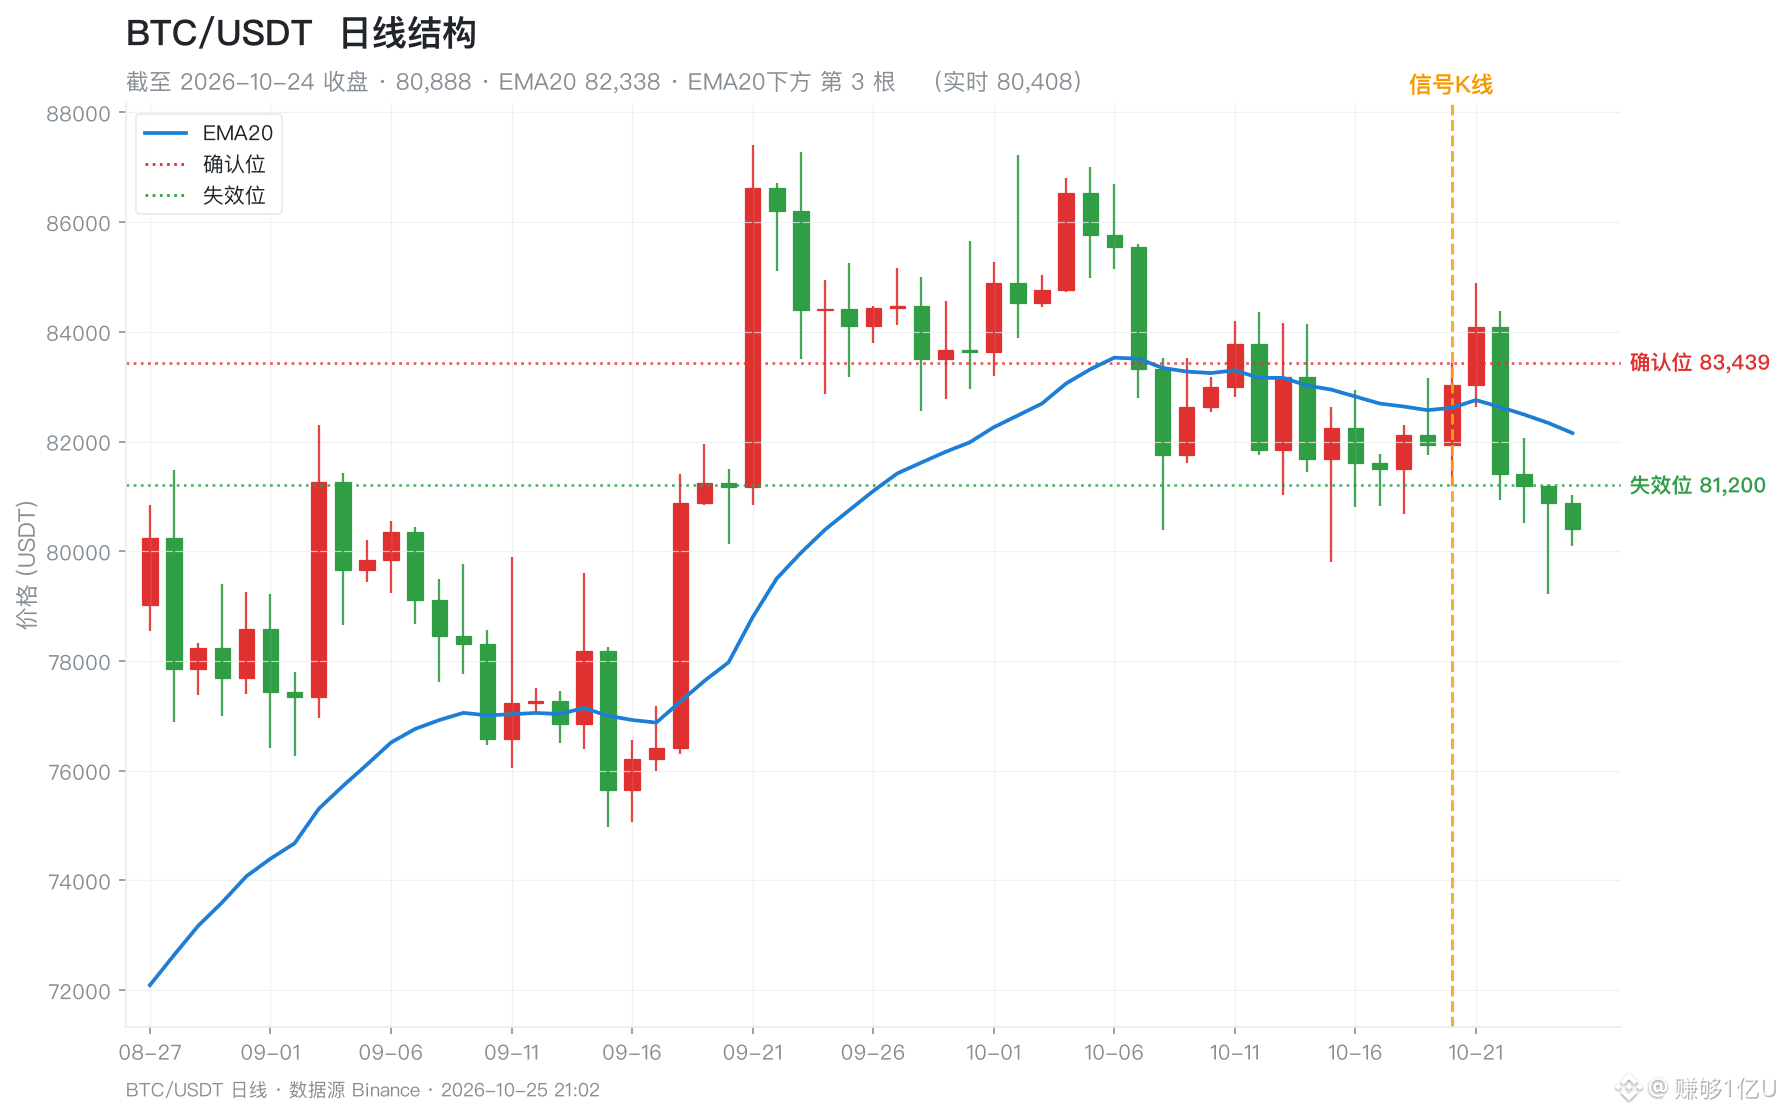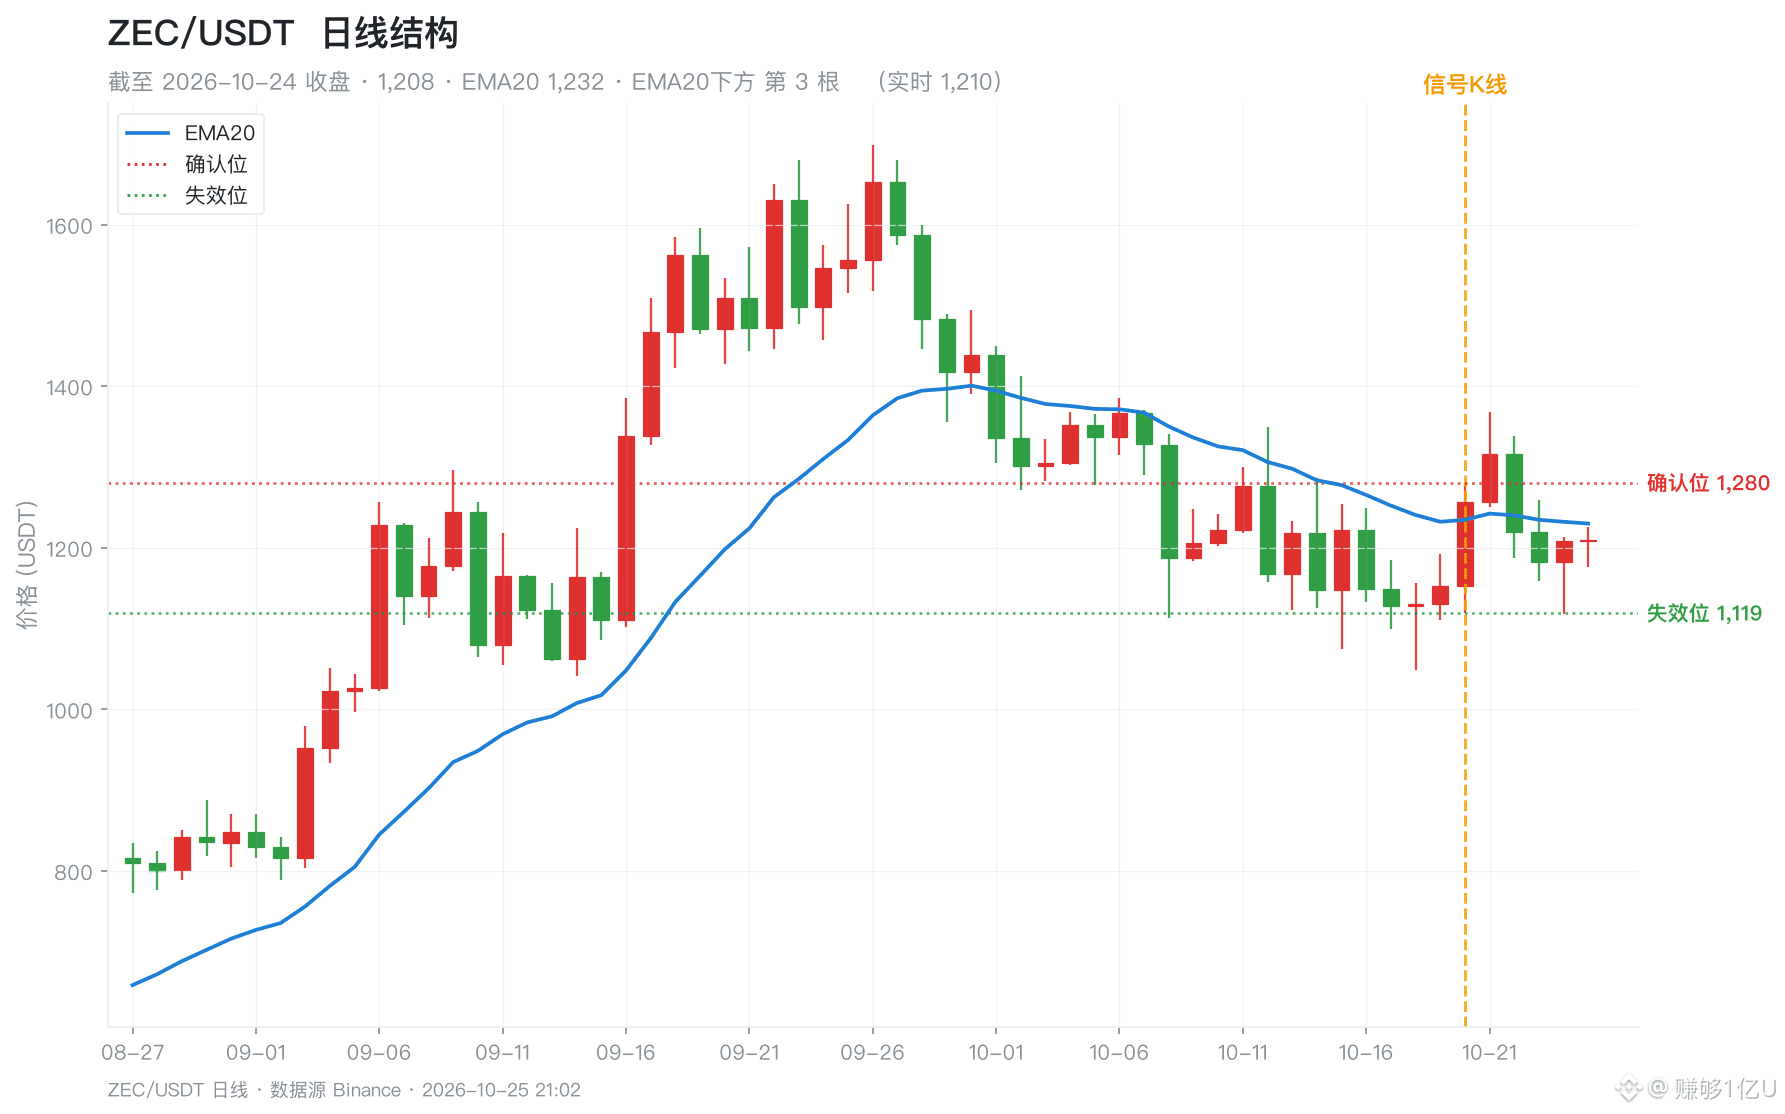
To wrap things up. The most important thing to remember today: two EMA20 signals that had both been confirmed ended up producing completely opposite outcomes.
$BTC closed at 80,888 on 10-24. After 6 consecutive candles below EMA20, it crossed above for the first time, then closed above 83,439 the next day to confirm the signal. But after confirmation, 3 consecutive candles fell back below EMA20 (82,338), and the latest close has already broken below the signal candle’s low of 81,200. By my rules, breaking below the signal candle’s low invalidates the setup, so the entry logic no longer holds. To the downside, I’m only watching the 20-day low at 79,220 as a reference level. I won’t predict whether it will hold.
$ZEC was confirmed on the same day (the signal came after 19 candles below EMA20, closing at 1,257, then breaking above 1,280 the next day). It’s now also on its 3rd candle below EMA20, closing at 1,208, with EMA20 at 1,232. The difference is that it hasn’t broken its invalidation level yet: 1,118.76 is the last line of defense, about 7% below the close. To the upside, it needs to reclaim 1,280 to salvage the confirmation.
So tomorrow, I’ll be watching two things:
① Will BTC first reclaim 81,200 and repair the invalidated structure, or continue down toward 79,220 for support?
② Will ZEC reclaim 1,280 first, or lose 1,118.76 first?
Drop a ticker in the comments—what are you watching, and what level is it stuck at? I’ll include it in tomorrow’s scan, and I’ll reply to each of you with the key structure levels.
#比特币 #结构复盘 #次日观察点 #EMA20
This is only a personal record of my trading structures and does not constitute investment advice.