

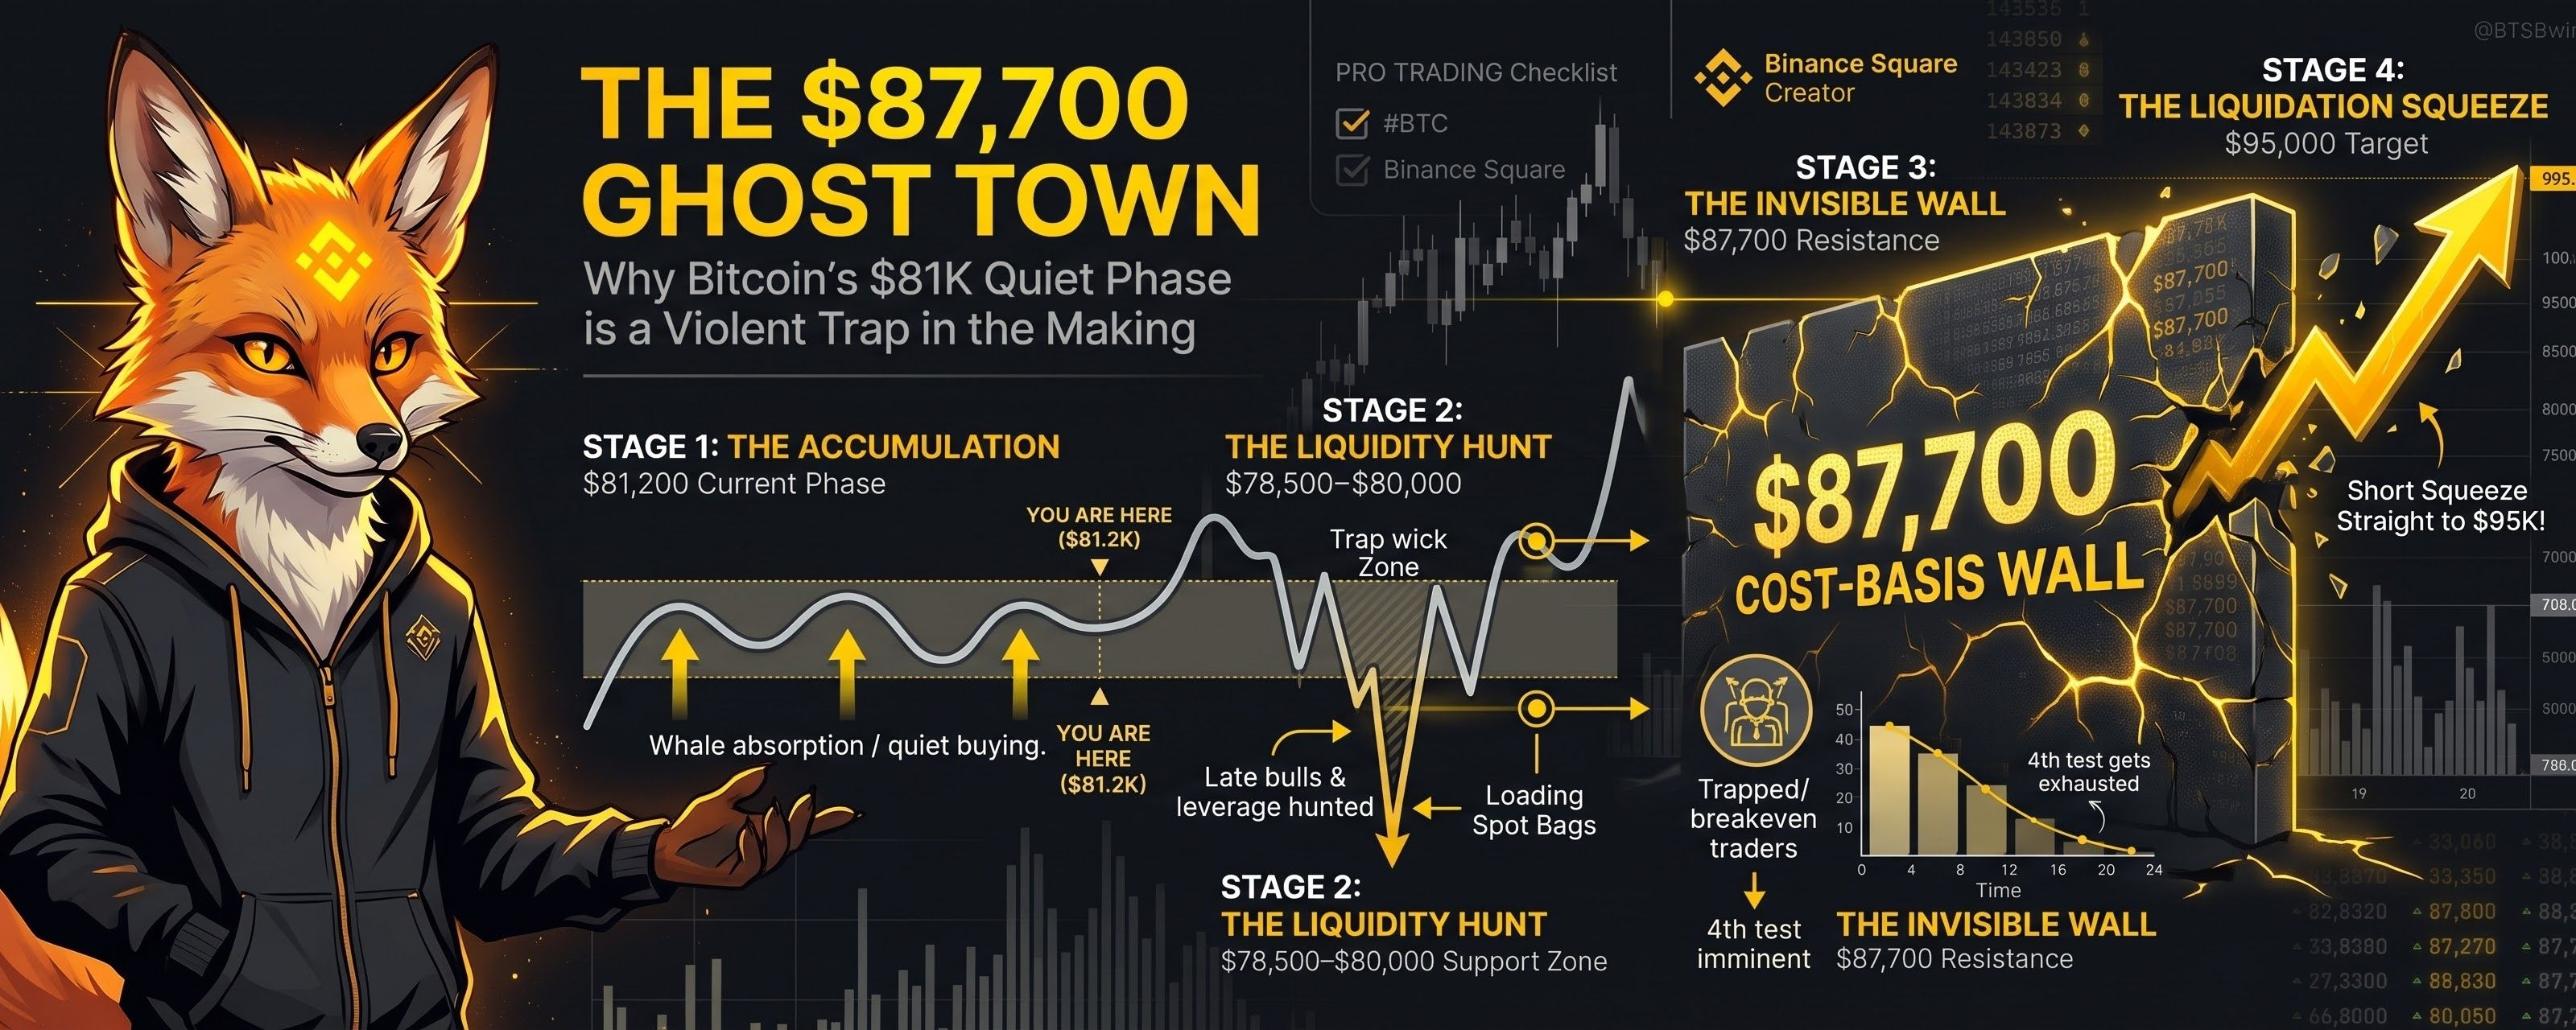


I woke up this morning, poured a black coffee, and stared at the 4-hour Bitcoin chart sitting right around $81,200. If you scroll through your feed today, you can practically smell the boredom mixed with quiet anxiety. Just a couple of days ago, everyone was high-fiving as we pushed past $83,400, talking about how $100k was right around the corner. Now, we drop a couple thousand dollars into the weekend, and suddenly the timeline is dead silent. Having traded through enough of these cycles, I can tell you that this exact silence is the biggest tell in the market. When retail traders get bored and start looking elsewhere because Bitcoin moves sideways for seventy-two hours, that is usually when the real money starts positioning for the next massive leg.
To understand where $BTC is going next week, you have to stop looking at the 15-minute candles and start looking at the psychology of the people who are currently trapped. On-chain data is showing a massive, invisible wall sitting right at $87,700. Why does that specific number matter so much? Because according to Glassnode’s cost-basis data, $87,700 is the average entry price for a huge wave of recent buyers who bought the top and have been underwater ever since. We already tried to break that ceiling three times lately—peaking at $87,397, then $87,283, and again at $87,249 earlier this month. Every single time we got close, those trapped buyers panicked, hit the sell button just to break even, and sent us right back down.
Right now, we are sitting in the middle of a psychological tug-of-war between $80,000 and $84,000. The market makers know that retail is terrified of another rejection at $87k, and they also know that impatient traders are over-leveraging on shorts thinking we are going to lose the $80,000 support. Look at what is happening under the hood while everyone is complaining about this choppy price action: large wallet holders have been quietly absorbing every single dip over the last 90 days. They aren't letting the price crash below the high $70k zone because they want those weak hands at $87,700 to exhaust themselves before the real breakout happens.
Here is my honest prediction and how I am playing this setup over the coming days. I am not touching high-leverage longs in the middle of this $81,000 chop, because the market loves to wick down and hunt liquidity right around the $78,500 to $80,000 psychological zone just to shake out the late bulls. If we get that quick flush into the high $70s, I am treating it as a gift to load up my spot bags. Why? Because the fourth time a major resistance wall gets tested after months of whale accumulation, it doesn't just break—it shatters. Once we finally absorb that $87,700 breakeven sell wall, there is almost no historical resistance left to stop a violent short squeeze straight toward $95,000.
The worst thing you can do right now is let a slow weekend chart trick you into giving up your position or chasing random pumpsout of boredom. Trading isn't about predicting every tiny $500 move; it is about seeing where the crowd is trapped and waiting for the spring to uncoil. I am keeping my alerts set at $79,500 for a dip-buy and $87,800 for the breakout confirmation, and until then, I am letting the impatient traders pay the funding fees. What is your gut telling you on this weekend move—are we flushing $80,000 first, or have the whales already bought enough to send $BTC straight through that $87,700 wall? Drop your chart thoughts below, let's see who is actually paying attention.
#BTC #bitcoin #CryptoMarketMoves t#tradingpsychology #SaidBNB