$VELVET 🤔 Trade Analysis
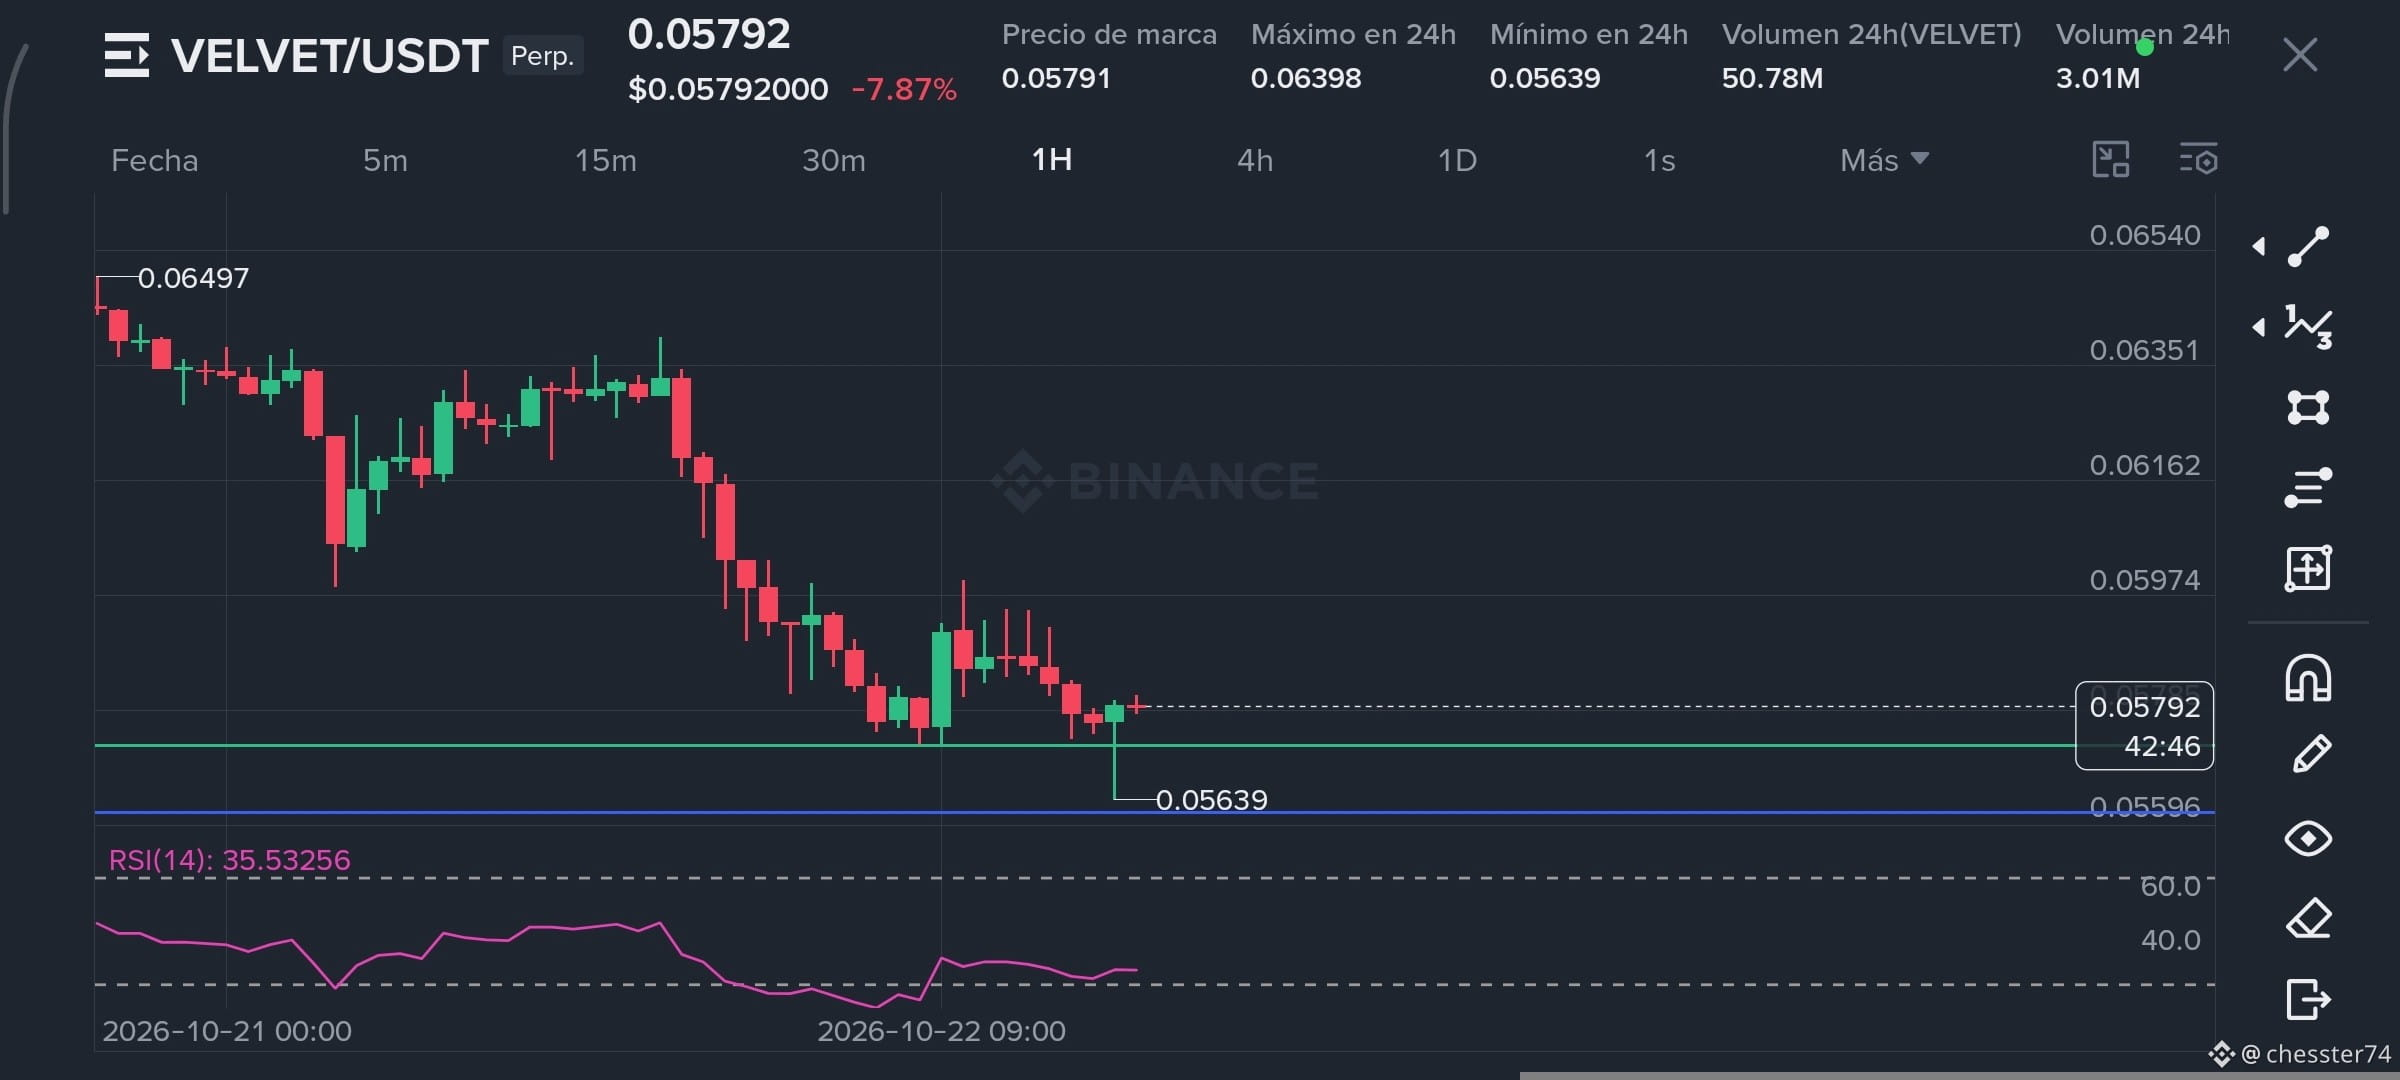
The problem was the execution. I have the strategy idea, but the issue was that I drew the support on the 1H timeframe.
✅ Step 1: Find an oversold market
(RSI below 30)
❌ Step 2: Find support
(in this case, since I’m looking for an oversold market, it’s no use having an oversold price if I don’t look for support)
Problem: I drew the support on the 1H timeframe, even though there was a candle still moving on a higher timeframe.
Step 3: Deceleration
(It may not happen.) In this case, I thought it hadn’t happened in this trade, so I skipped to Step 4.
Step 4: Reversal candle
I thought a bullish engulfing candle at support was perfect—the trade met the conditions.
Conclusion: What was missing was the trading style. In other words, I applied the strategy on the 1H chart. If I had used scalping, it would have been different, because I would use the 1H chart for support, look for the other steps on the 15-minute chart, and execute on the 5-minute chart. You either win or learn and keep improving 💪.
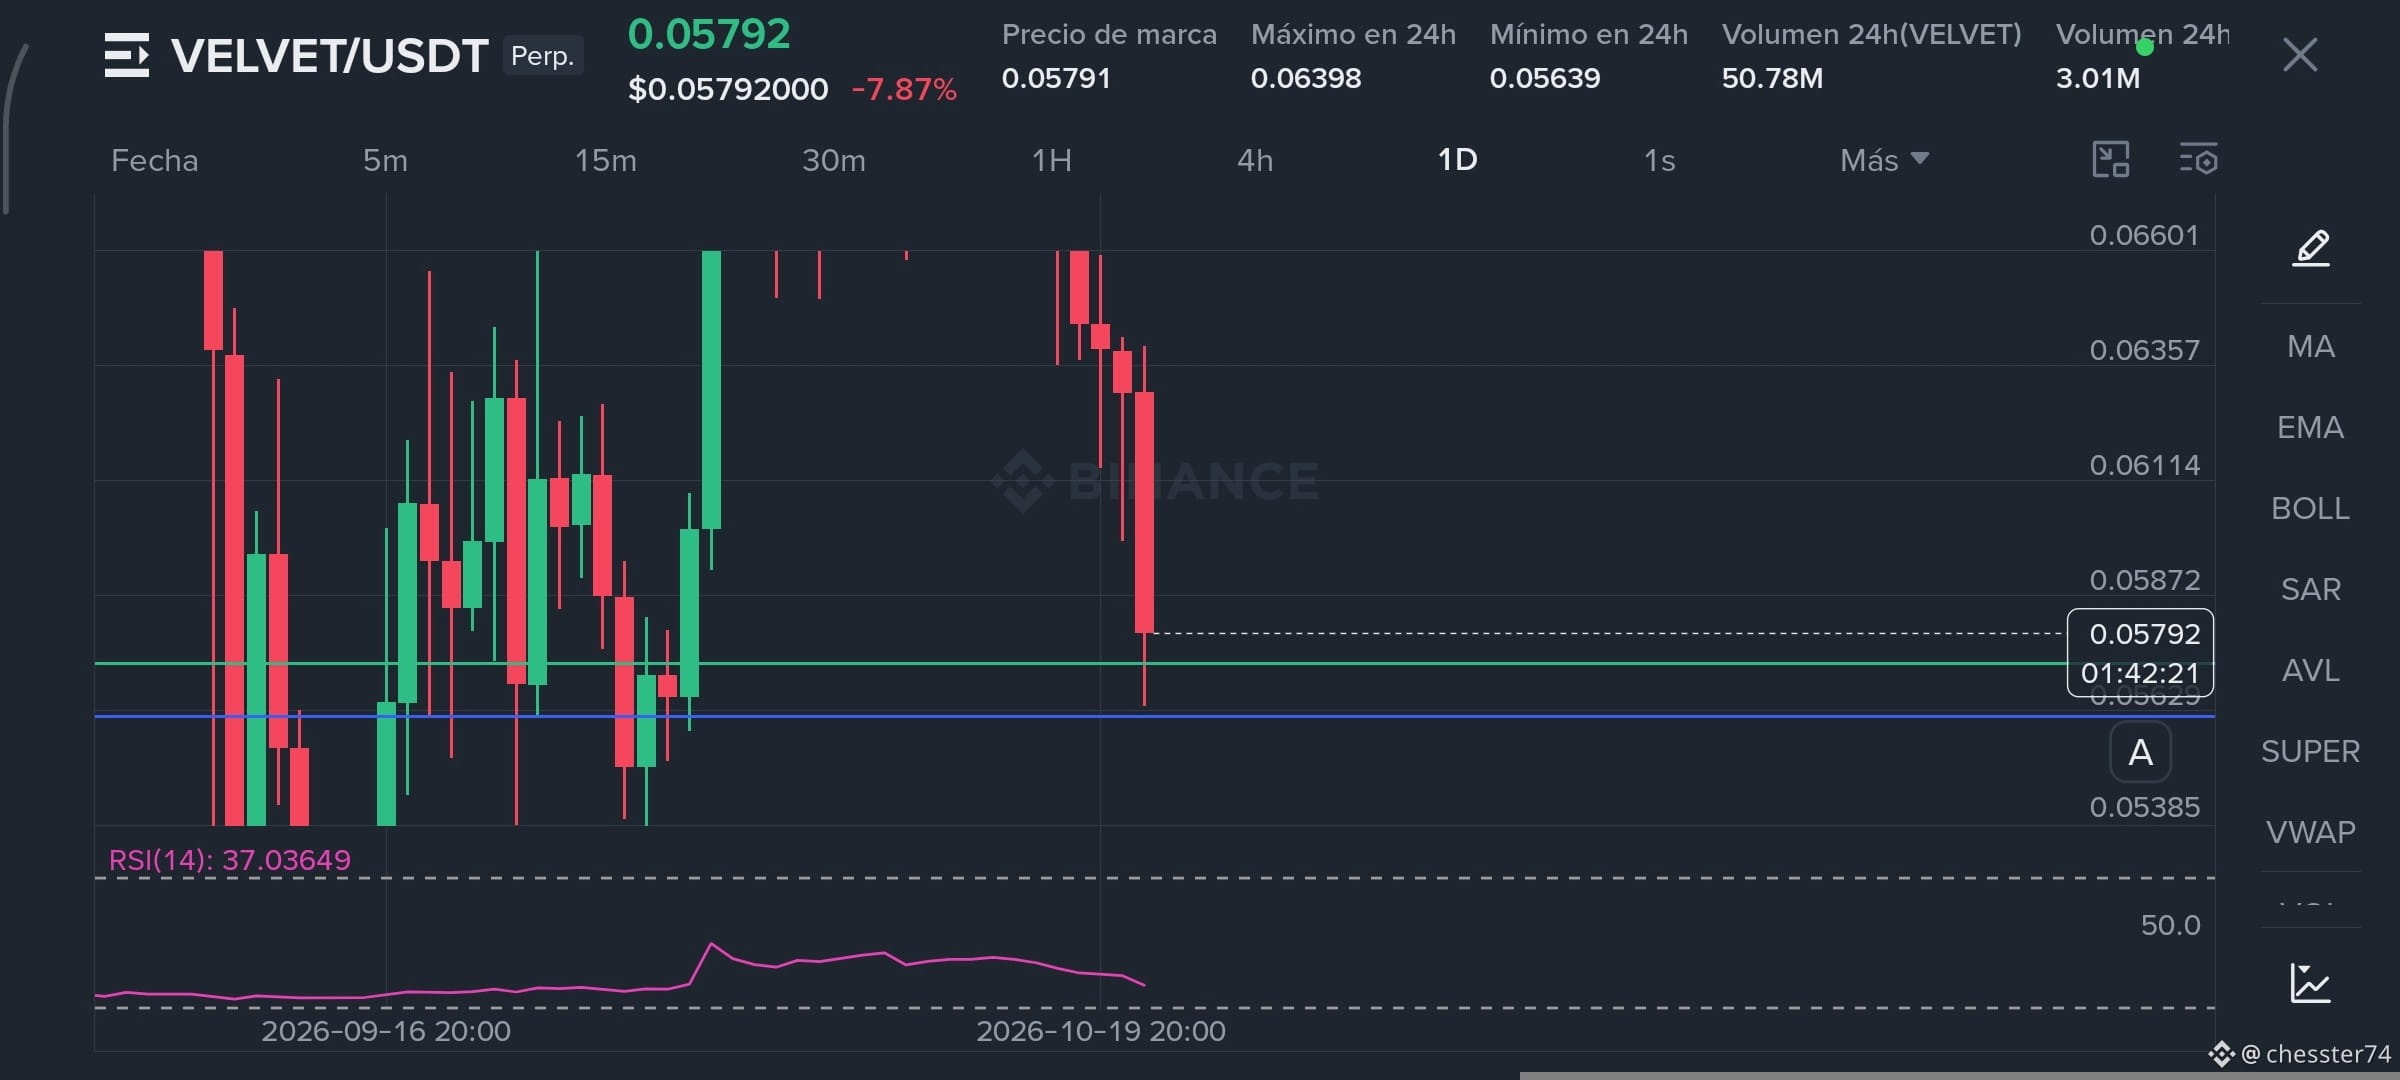
I think the right move was to draw support on the 1D timeframe (the blue line in the image), then wait for the price to reach that line on smaller timeframes. That’s what happened: it took liquidity (by hitting the SL), and then I should have waited to see what happened.
Does the price slow down when it reaches support, or is there a reversal candle? That way, I think the trade has a higher chance of success.
Some changes I made were removing the indicators to avoid overanalyzing and focus on applying the strategy I’m studying and practicing. Now I’m waiting to see another opportunity in the market 👀
The problem was the execution. I have the strategy idea, but the issue was that I drew the support on the 1H timeframe.
✅ Step 1: Find an oversold market
(RSI below 30)
❌ Step 2: Find support
(in this case, since I’m looking for an oversold market, it’s no use having an oversold price if I don’t look for support)
Problem: I drew the support on the 1H timeframe, even though there was a candle still moving on a higher timeframe.
Step 3: Deceleration
(It may not happen.) In this case, I thought it hadn’t happened in this trade, so I skipped to Step 4.
Step 4: Reversal candle
I thought a bullish engulfing candle at support was perfect—the trade met the conditions.
Conclusion: What was missing was the trading style. In other words, I applied the strategy on the 1H chart. If I had used scalping, it would have been different, because I would use the 1H chart for support, look for the other steps on the 15-minute chart, and execute on the 5-minute chart. You either win or learn and keep improving 💪.
I think the right move was to draw support on the 1D timeframe (the blue line in the image), then wait for the price to reach that line on smaller timeframes. That’s what happened: it took liquidity (by hitting the SL), and then I should have waited to see what happened.
Does the price slow down when it reaches support, or is there a reversal candle? That way, I think the trade has a higher chance of success.
Some changes I made were removing the indicators to avoid overanalyzing and focus on applying the strategy I’m studying and practicing. Now I’m waiting to see another opportunity in the market 👀