



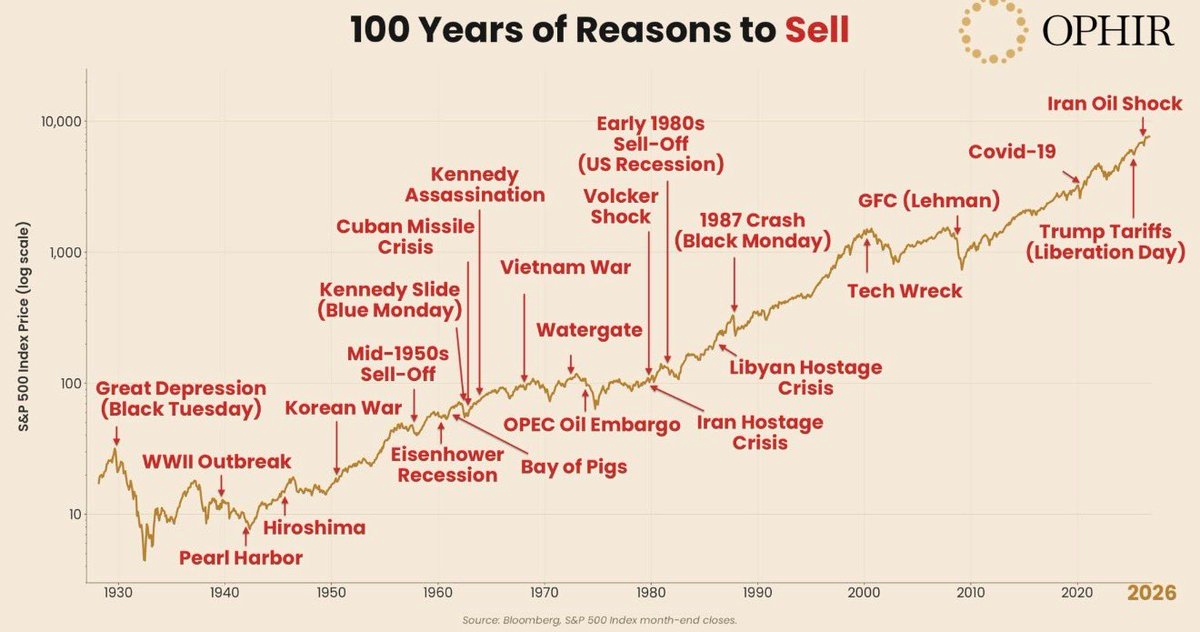
The chart highlights more than 25 events, each offering a “logical reason to sell”: the Great Depression, World War II, the Cuban Missile Crisis, the oil embargo, the 1987 crash, the dot-com bubble, the collapse of Lehman Brothers, COVID, tariffs, and the Iranian oil shock.
Despite all of this, the S&P 500 has risen from around 17 points in 1928 to more than 7,700 today.
But the deeper lesson goes beyond “the market always goes up.” The data tells a more precise story.
1. Drawdowns are the rule, not the exception
• The index has delivered an annualized return of roughly 10% since 1928.
• It finished higher in approximately 73% of calendar years.
• Yet 62% of years experienced an intra-year correction of at least 10%, with the average intra-year drawdown reaching around 16%.
The takeaway: Volatility is the price of returns, not proof that the market is broken.
2. Recovery times vary from crisis to crisis
• Great Depression: An approximately 82% decline. Investors had to wait until 1945 to recover their losses, even with dividends reinvested.
• 2008 financial crisis: A roughly 57% decline, with recovery in 2013.
• COVID-19 in 2020: A roughly 34% drop in 33 days, followed by a recovery within five months.
• 2025 tariffs: A roughly 19% decline, followed by recovery in about three months.
The takeaway: Nobody knows in advance how long a crisis will last. That's why your investment horizon matters more than your ability to predict the future.
3. The cost of exiting can exceed the cost of a drawdown
According to J.P. Morgan data, $10,000 invested in the S&P 500 from 2006 through 2025 grew to $80,619.
But missing just the 10 best trading days, roughly 0.2% of trading days, reduced the final value to $35,866.
The irony? Most of the best days occurred within two weeks of the worst days, right when fear was at its peak.
4. The biggest problem is behavioral, not purely market-driven
In 2024, the average investor in equity funds earned 16.5%, while the index itself returned 25%.
The market didn't create that gap. Investor decisions to enter and exit did.
An important methodological caveat:
The chart covers only the U.S. market, historically one of the most successful markets, a classic example of survivorship bias. It also excludes inflation.
So the lesson isn't “buy anything and hold it forever.”
It's this:
Diversification + a long investment horizon + a written plan that you follow during panic, rather than create in the middle of it.
The bottom line:
Headlines answer the question, “What's happening right now?”
But long-term returns depend on a different question:
“Can I withstand what is happening?”
