

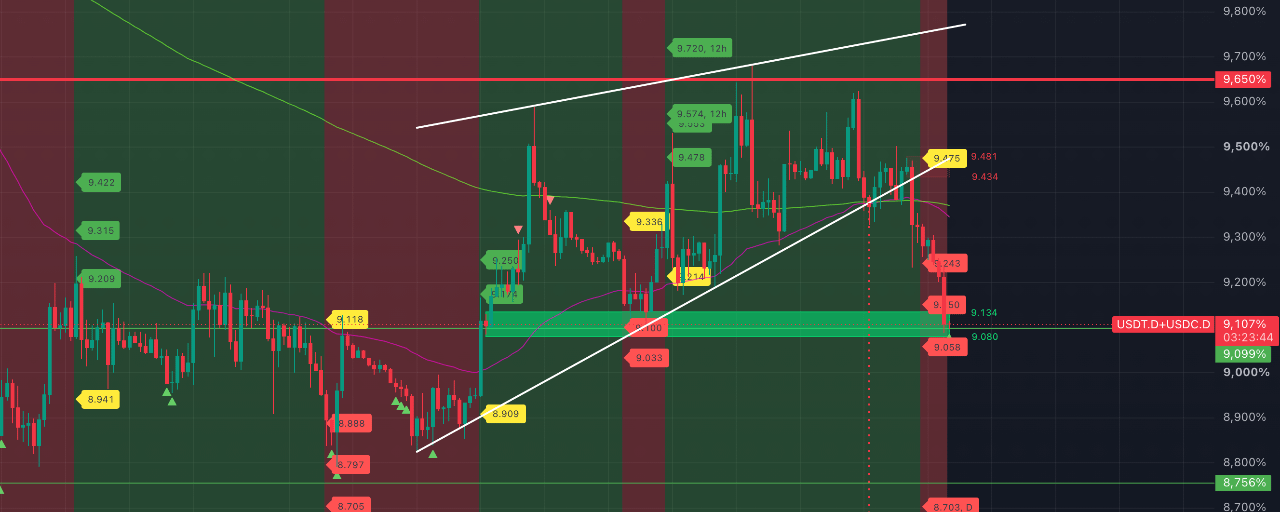


USDT+USDC stablecoin dominance has once again reached the important 9.099% level. The last time we looked at this metric was on September 23, when it had just reached 9.099% as resistance during a bounce. Along the way, it also showed a Strong signal of a potential high on the hourly timeframe.
This ended with stablecoin dominance consolidating between the 9.099% and 8.756% levels, and breaking upward only during the market correction that began on October 7.
The dominance high ultimately came in at 9.684% on October 15. And this is very telling because, as a reminder, according to our analysis, the dominance level that separates the bear and bull phases of the crypto market is 9.650%. In other words, on the rebound, the metric retested this level and then moved lower. It held in the bull market zone.
This is an EXTREMELY important moment, because the market trend over the coming weeks will apparently depend on the reaction to the test of the 9.099% level.
On the 4-hour timeframe, there has been a steady downtrend here since yesterday, and the last basic target at 9.058% has almost been reached. At the same time, there is already a second marker for a potential low, which gives the bears a chance to hold the level.
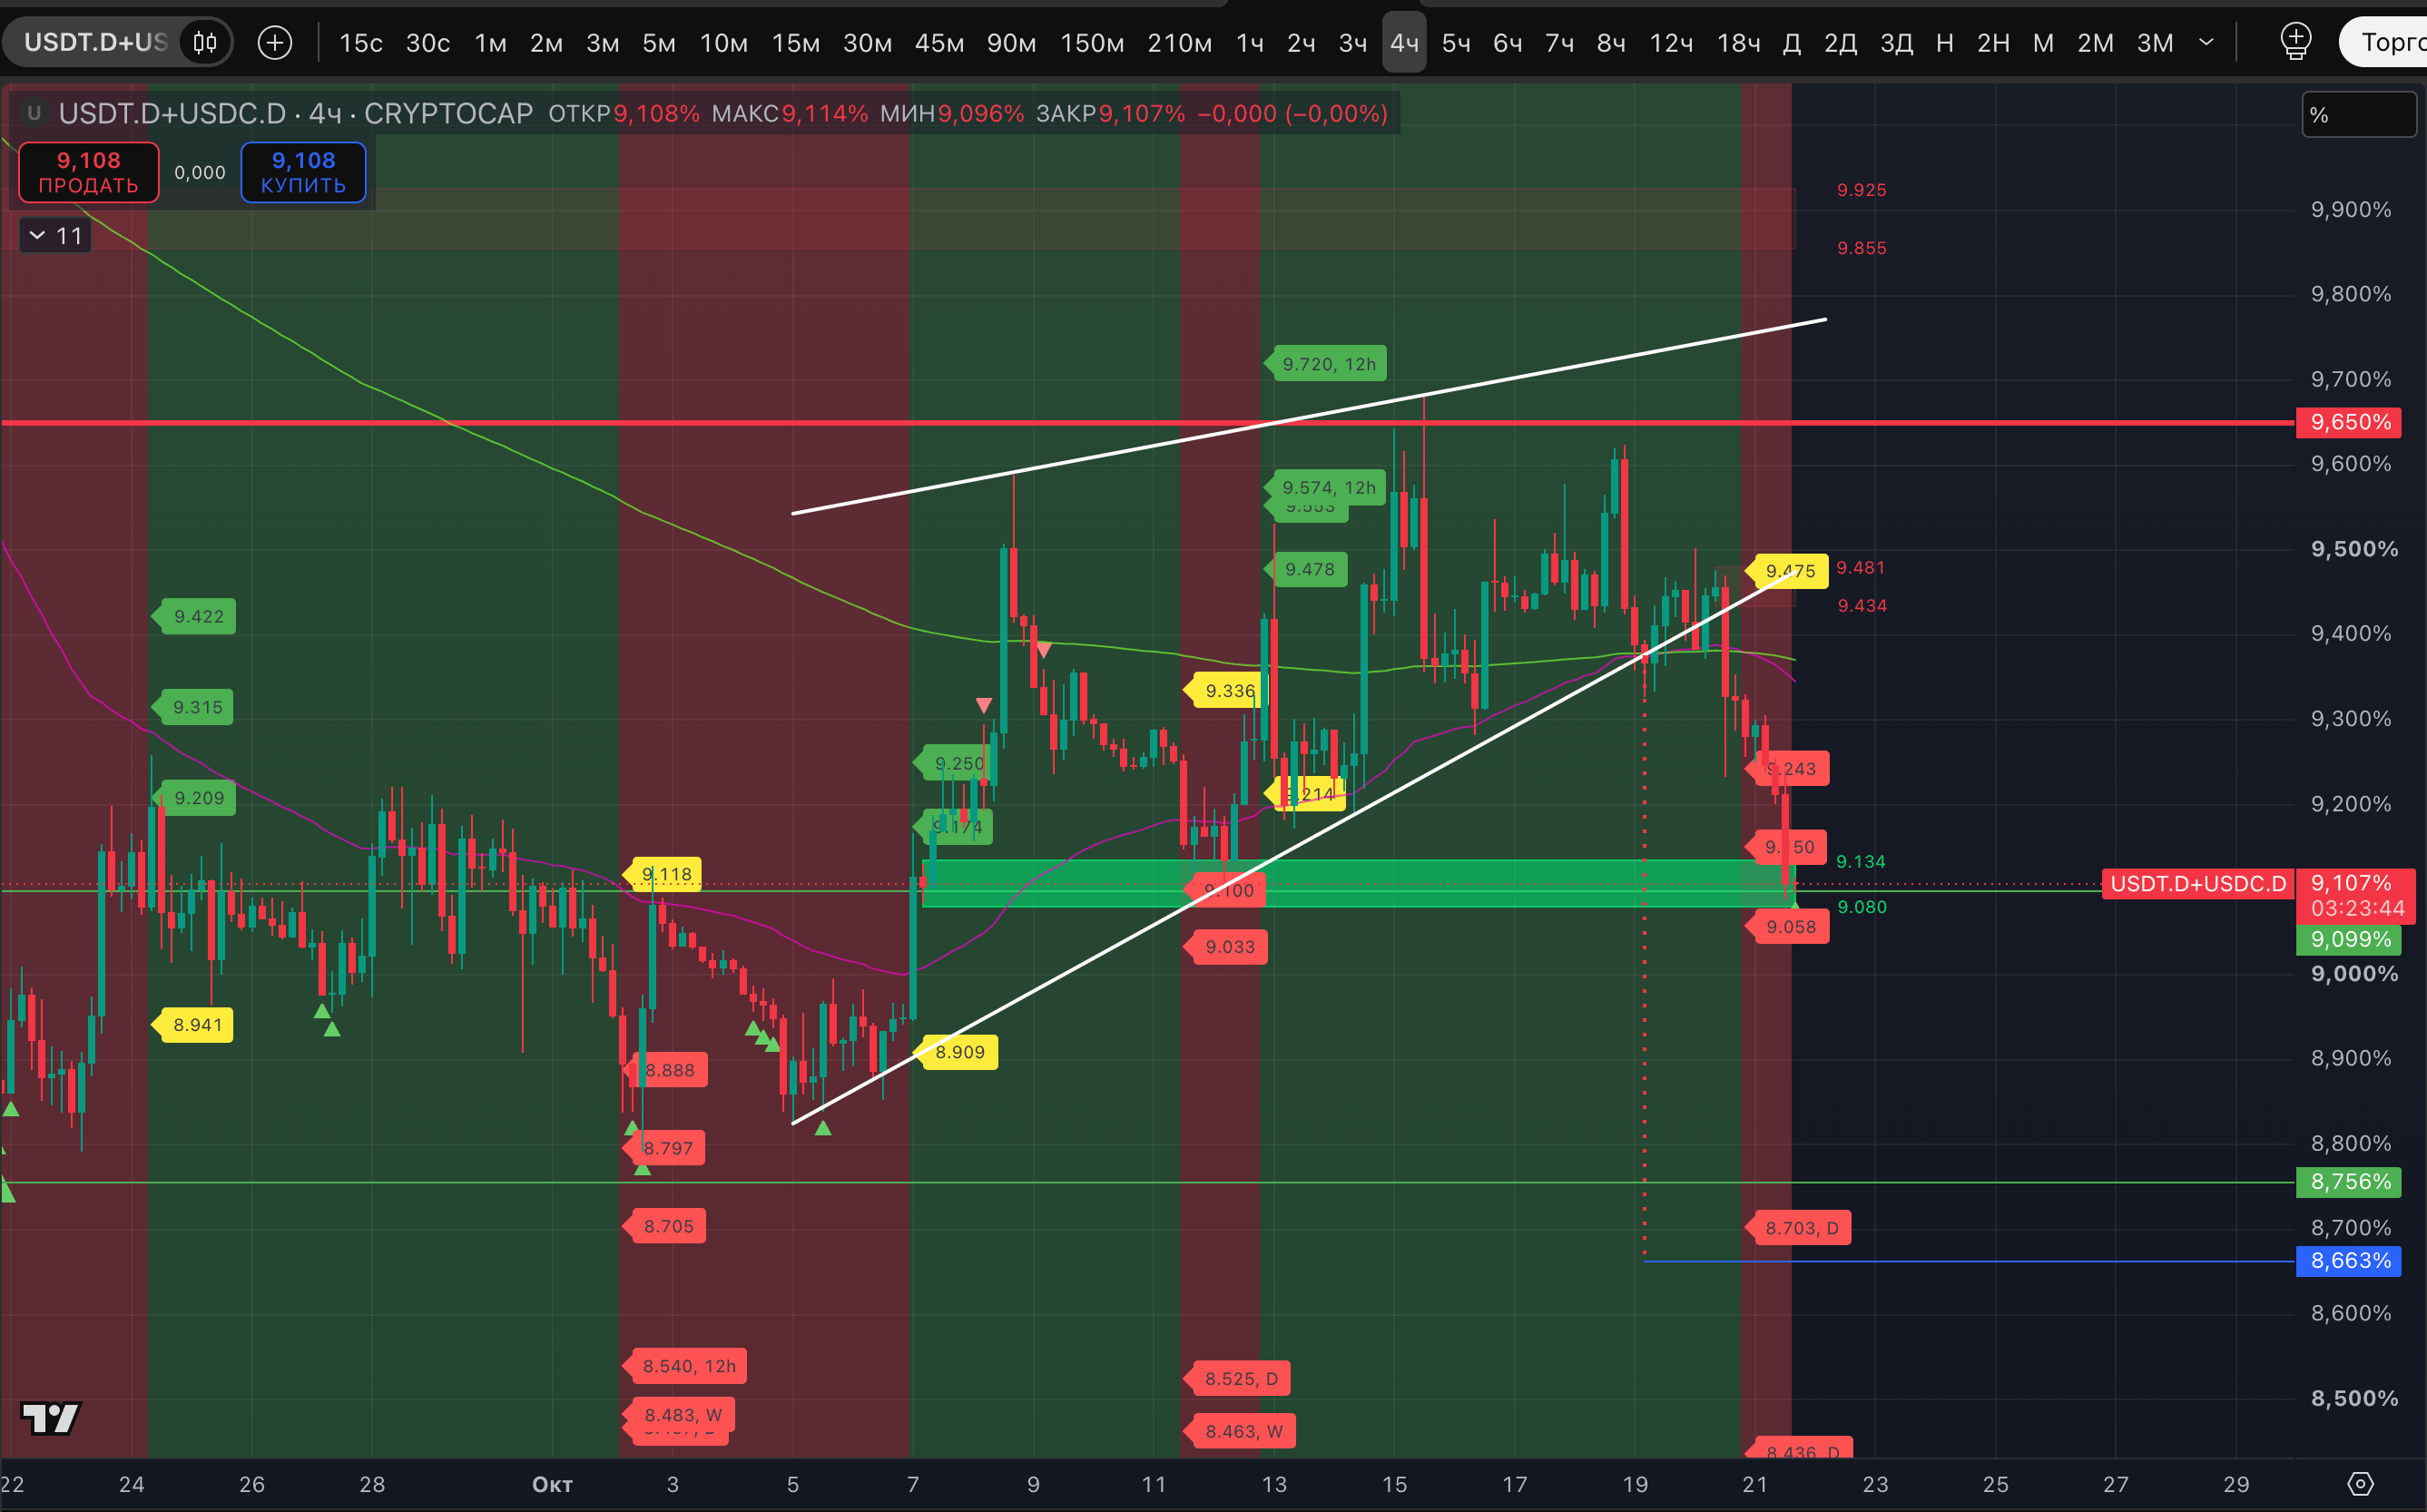
But what is NOT in the bears’ favor is, ironically, the “Bearish Wedge,” which is already playing out and has a full target around 8.663%. Part of the move has already played out. As long as the metric maintains steady uptrends on the 12- and 18-hour timeframes, whether the pattern will continue to play out remains uncertain.
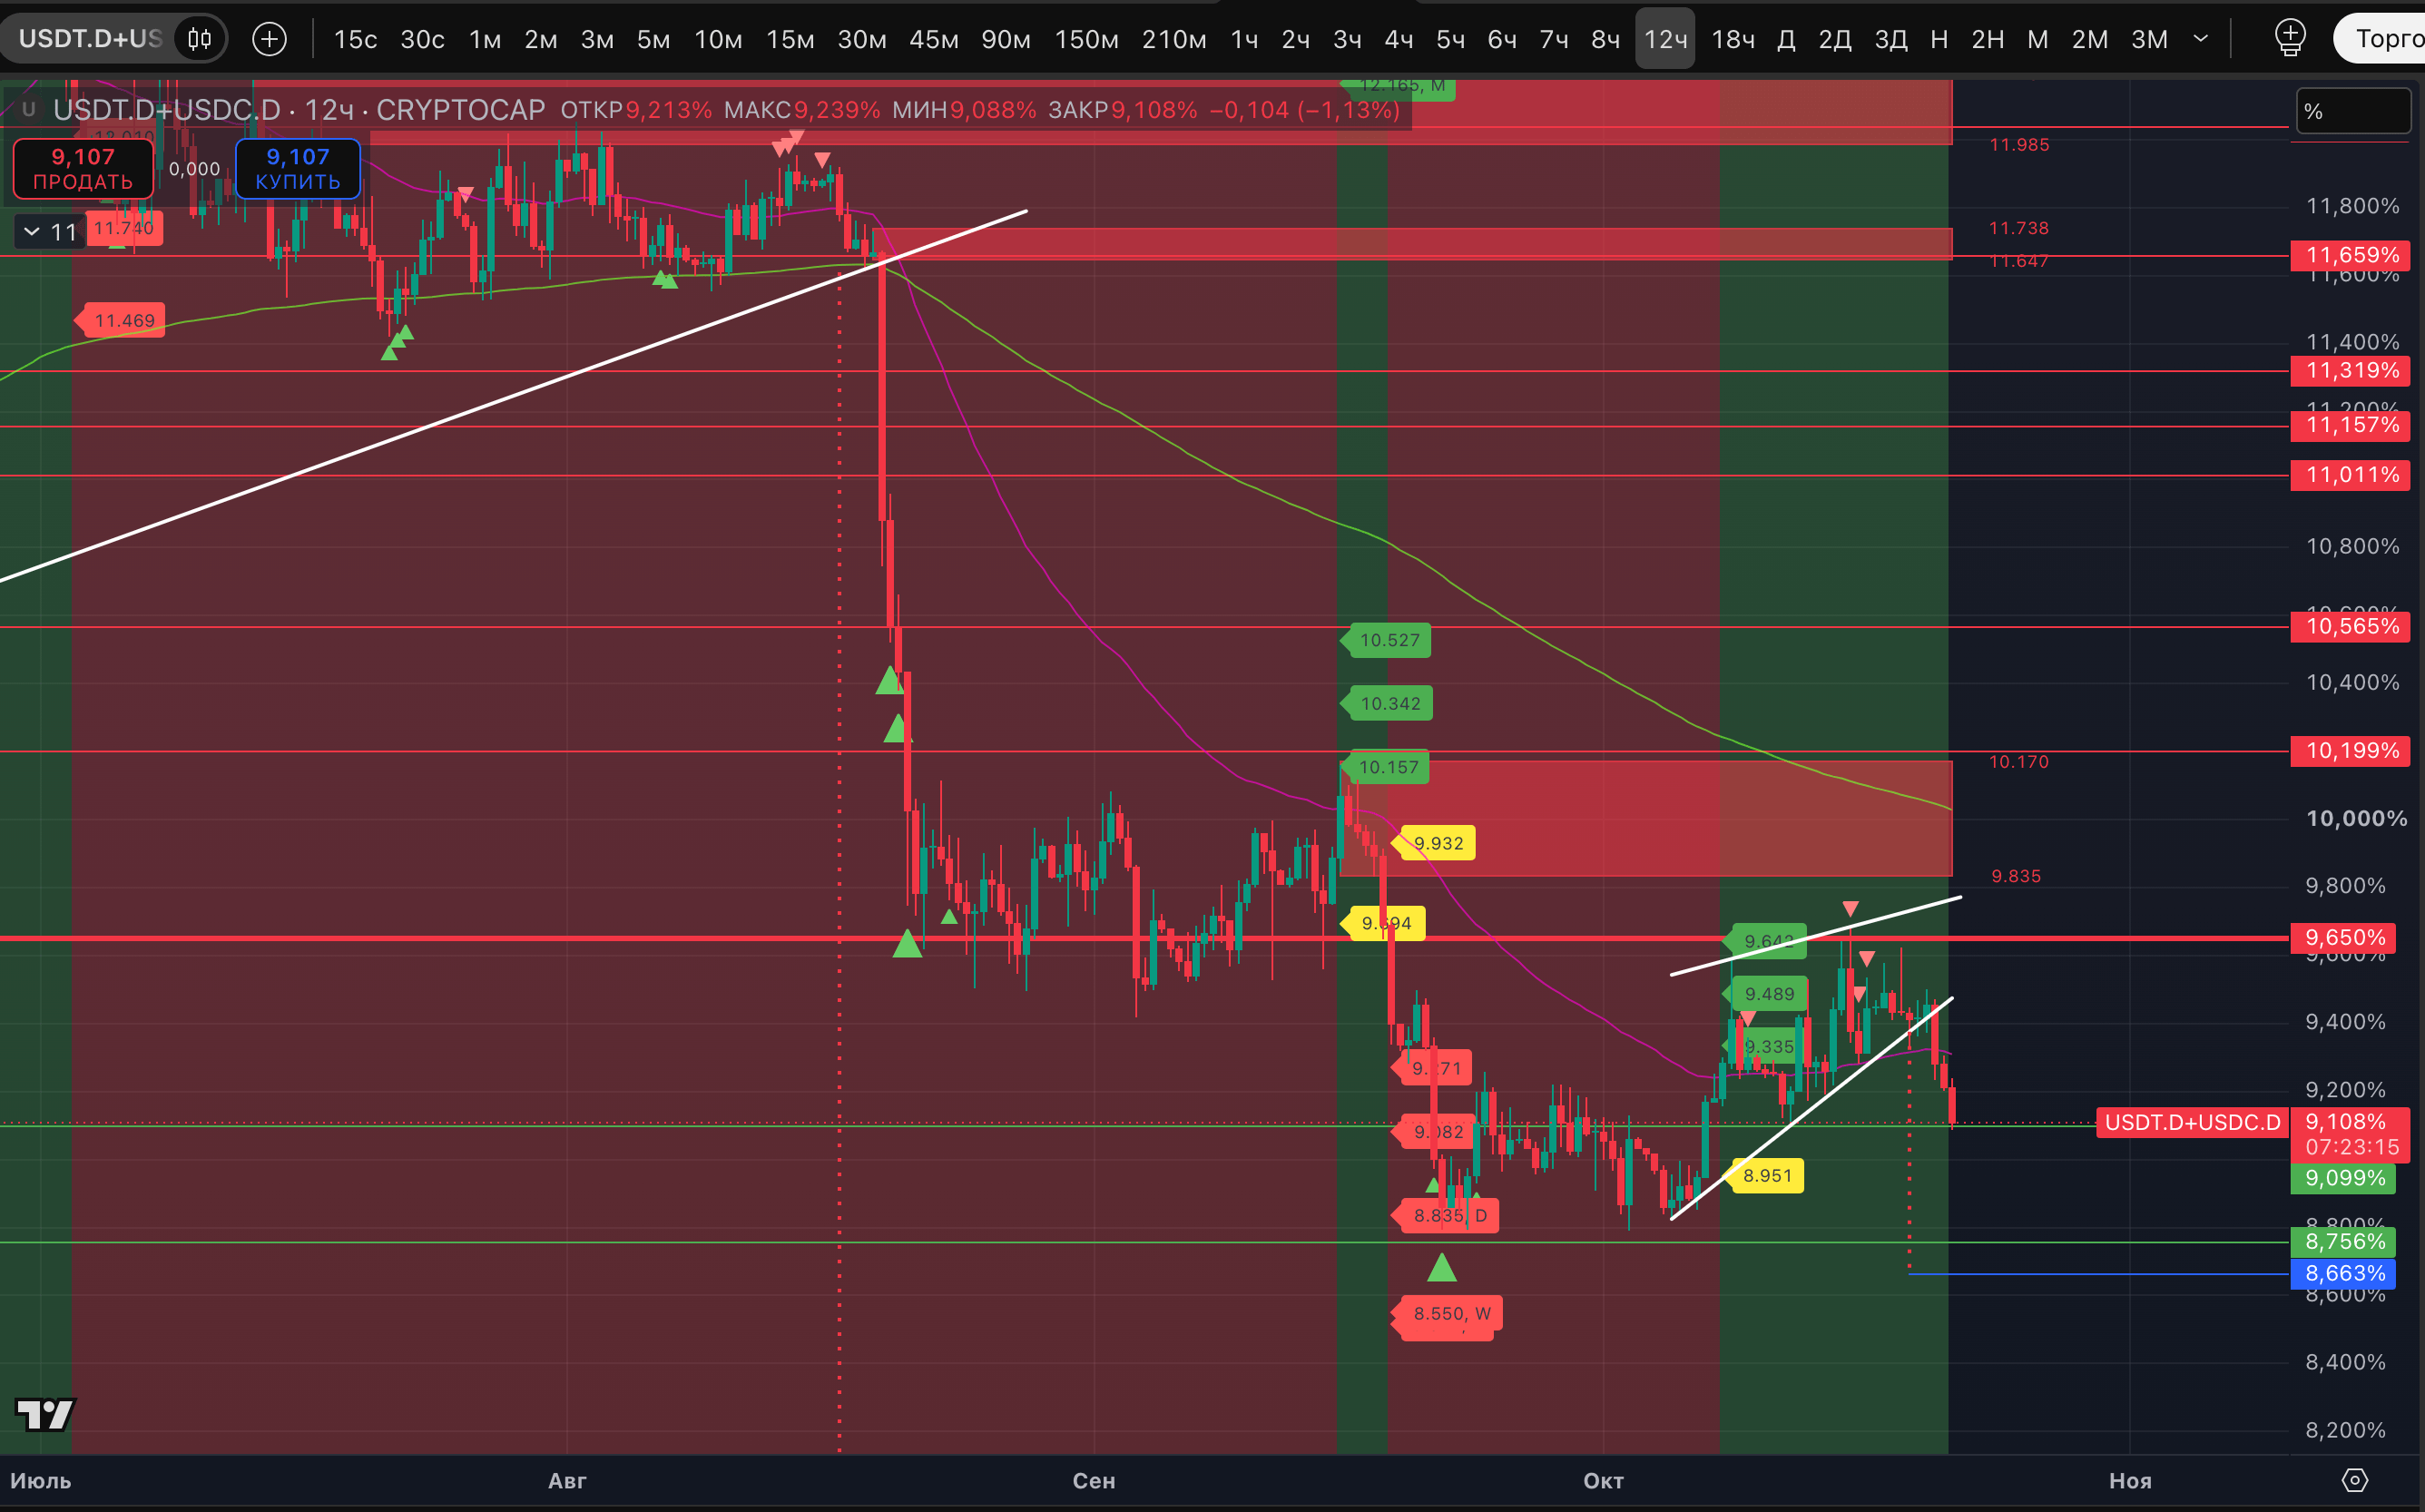
But if those uptrends break, the pattern will most likely continue to play out. For BTC specifically, this would mean a potential move to $87,000, whose importance has been highlighted by Glassnode.