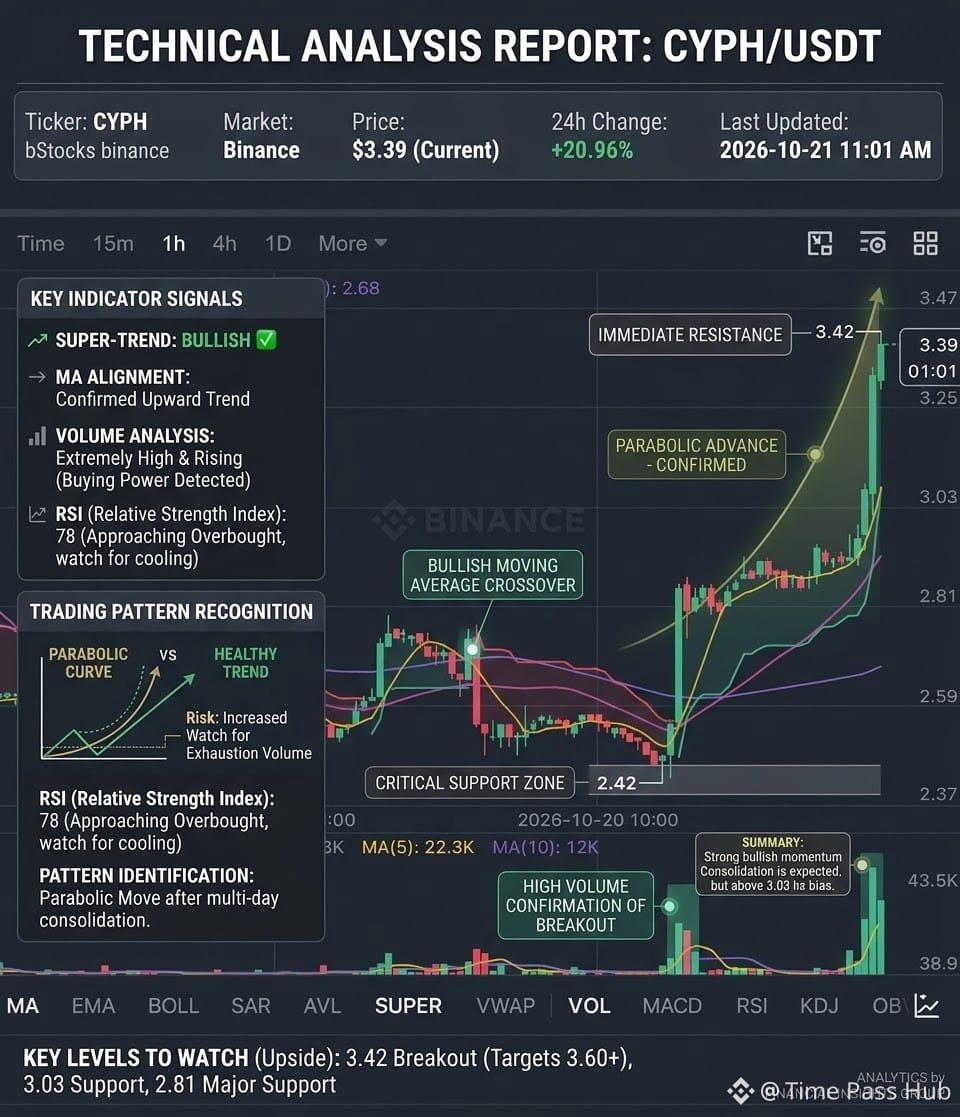
Here is the technical analysis report generated based on the $CYPHB /USDT chart you provided.
This analysis highlights several key aspects of the recent market activity:$CYPHB
Indicator Signals: The Super-Trend is confirmed Bullish, and the price action shows a confirmed upward trend with a Bullish Moving Average crossover.
Volume & RSI: There is a high-volume confirmation of the breakout, with a parabolic advance confirmed. However, the RSI is currently around 78, indicating the asset is approaching overbought territory and may need a cooling-off period.
Key Support & Resistance: The report identifies 3.42 as immediate resistance. Major support lies at 2.81 and 3.03.
#Binance #MarketAnalysis #crypto #Write2Earn #TrendingTopic $CYPHB