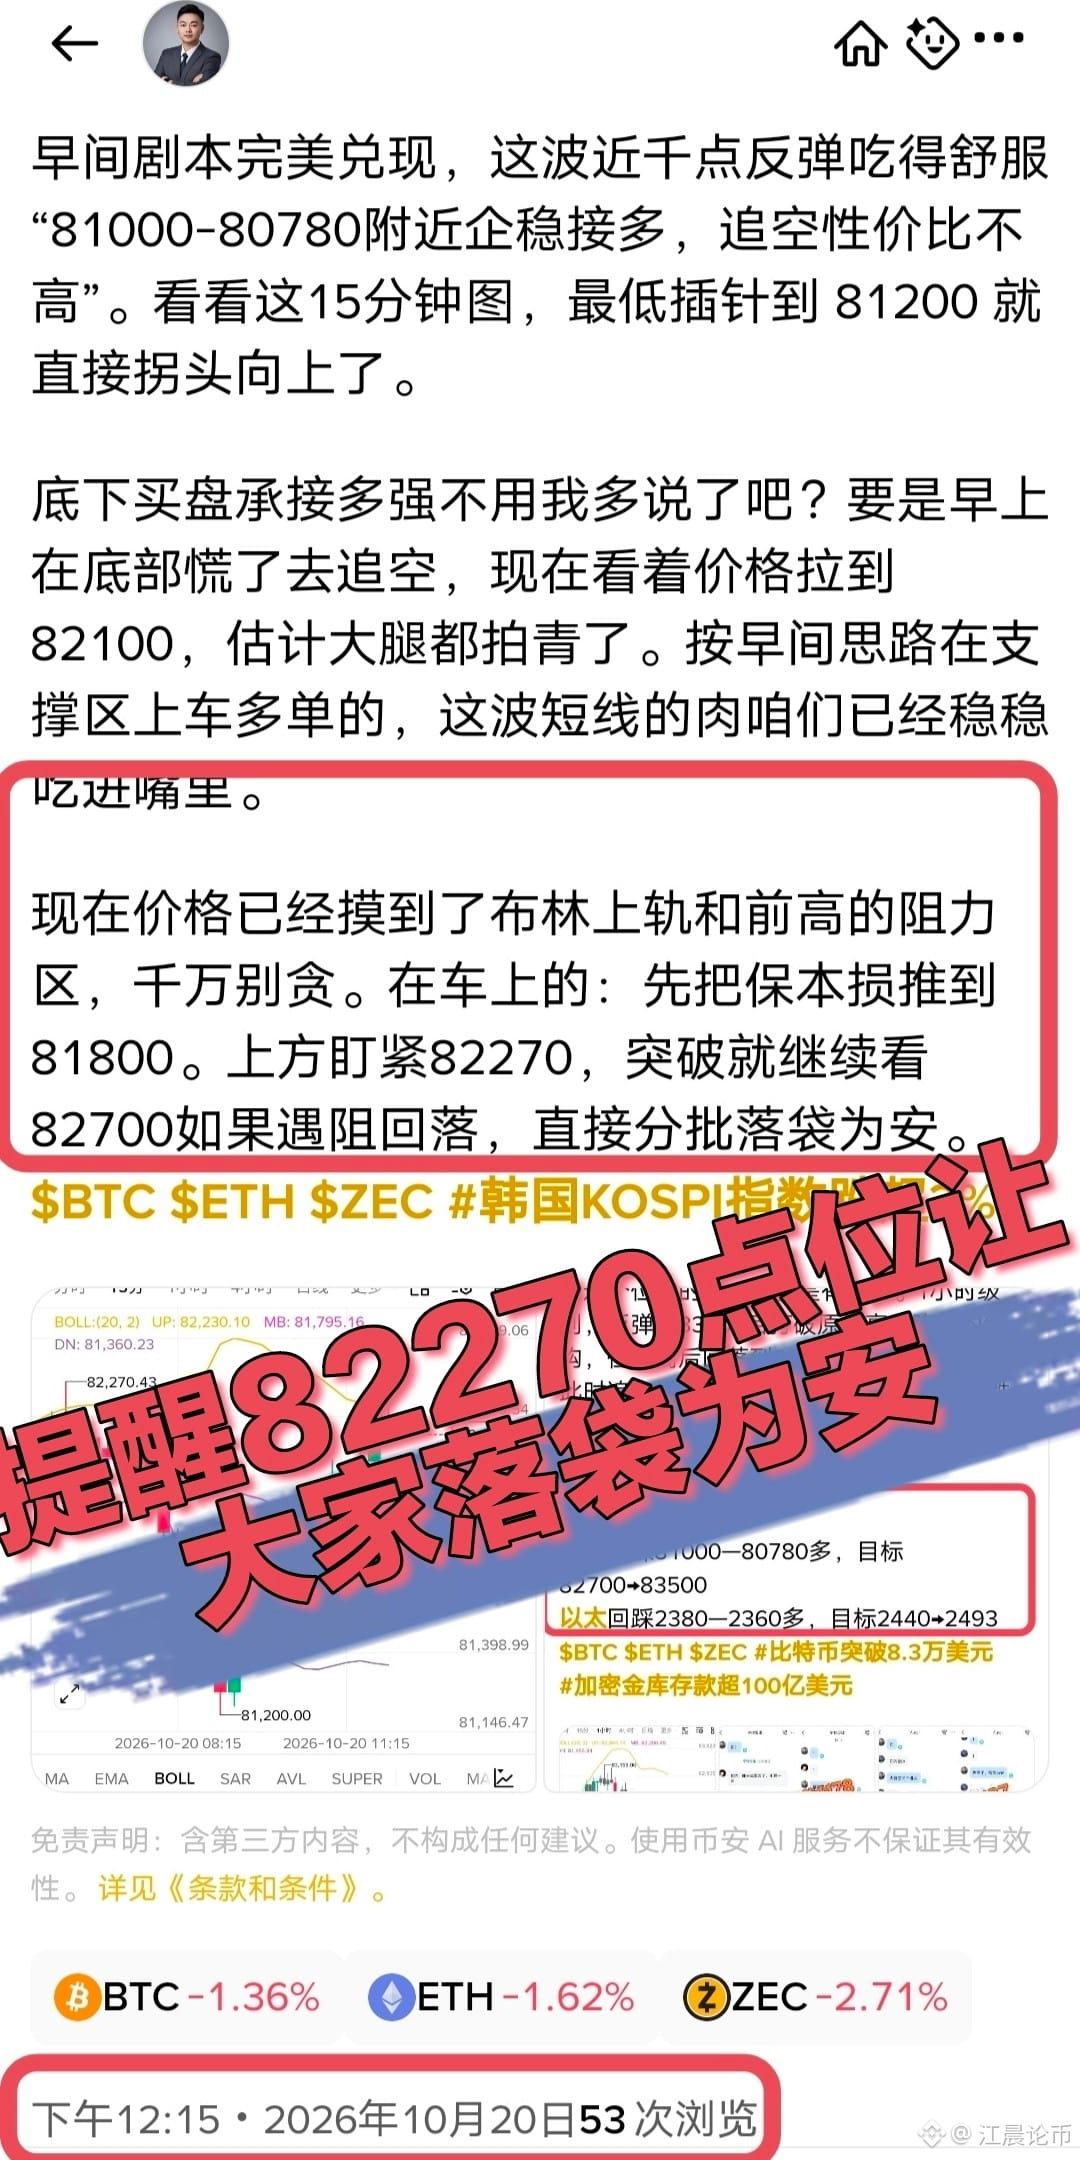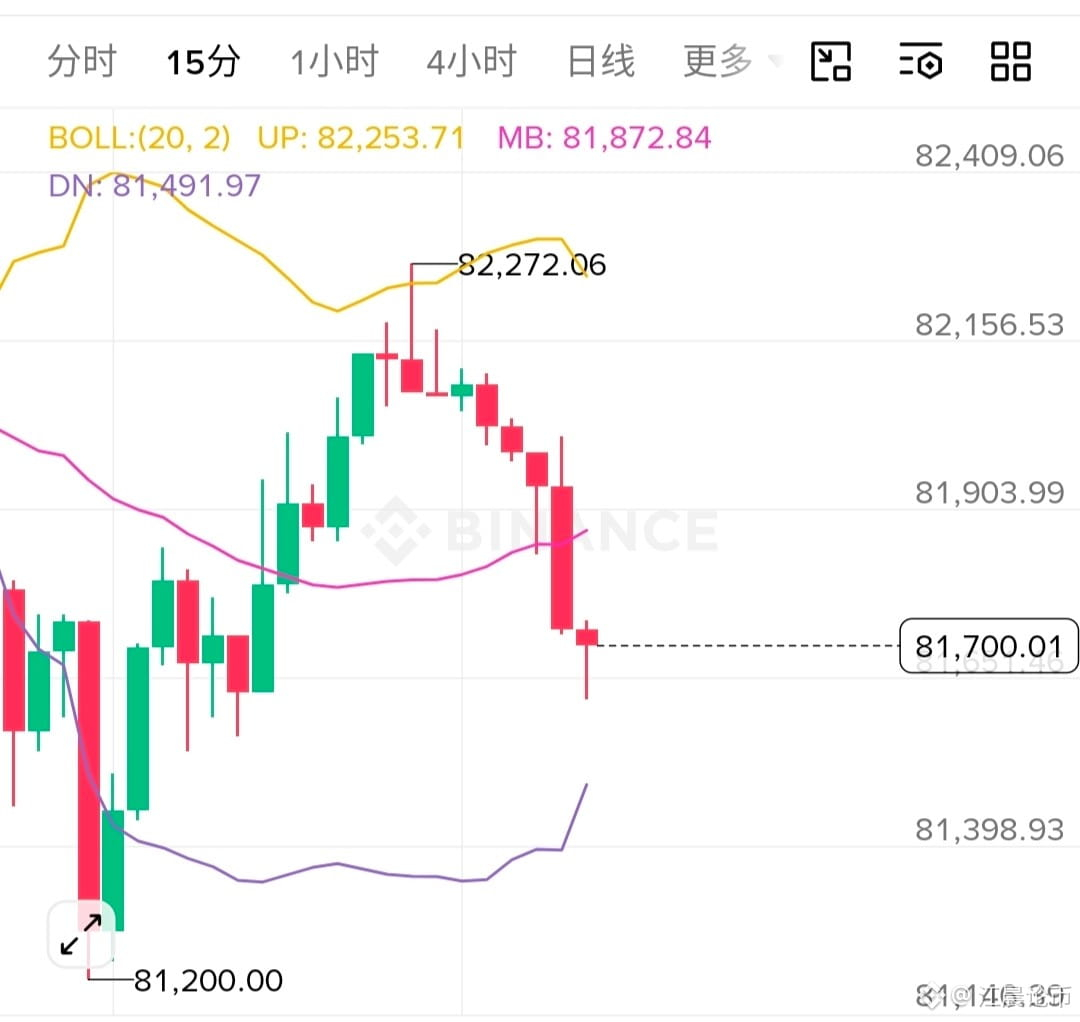
Bitcoin surged to 82272 around midday, almost exactly matching the previous high resistance level of 82270 we identified earlier. It then turned sharply downward, and those who followed Jiang Chen’s analysis made another profitable trade.
Let’s take a look at the 15-minute chart. The previous run of consecutive bullish candles surged straight above the upper band. The short-term rally was too steep, and after pulling back from the highs, several bearish candles came crashing down in a row, breaking below the middle band. The candle at the high closed with a long upper wick, followed by several consecutive bearish candles, showing clear and heavy selling pressure overhead. But look at the candle at the very bottom: it dropped to around 81700 and closed with a lower wick, suggesting that the bears met resistance there. The bulls are still fighting back.
For now, let’s wait patiently and see if the price tests the area around 81300. We’ll watch for a sign that the decline is stopping there, then decide whether to enter a trade.
$BTC $ETH $ZEC #加密金库存款超100亿美元