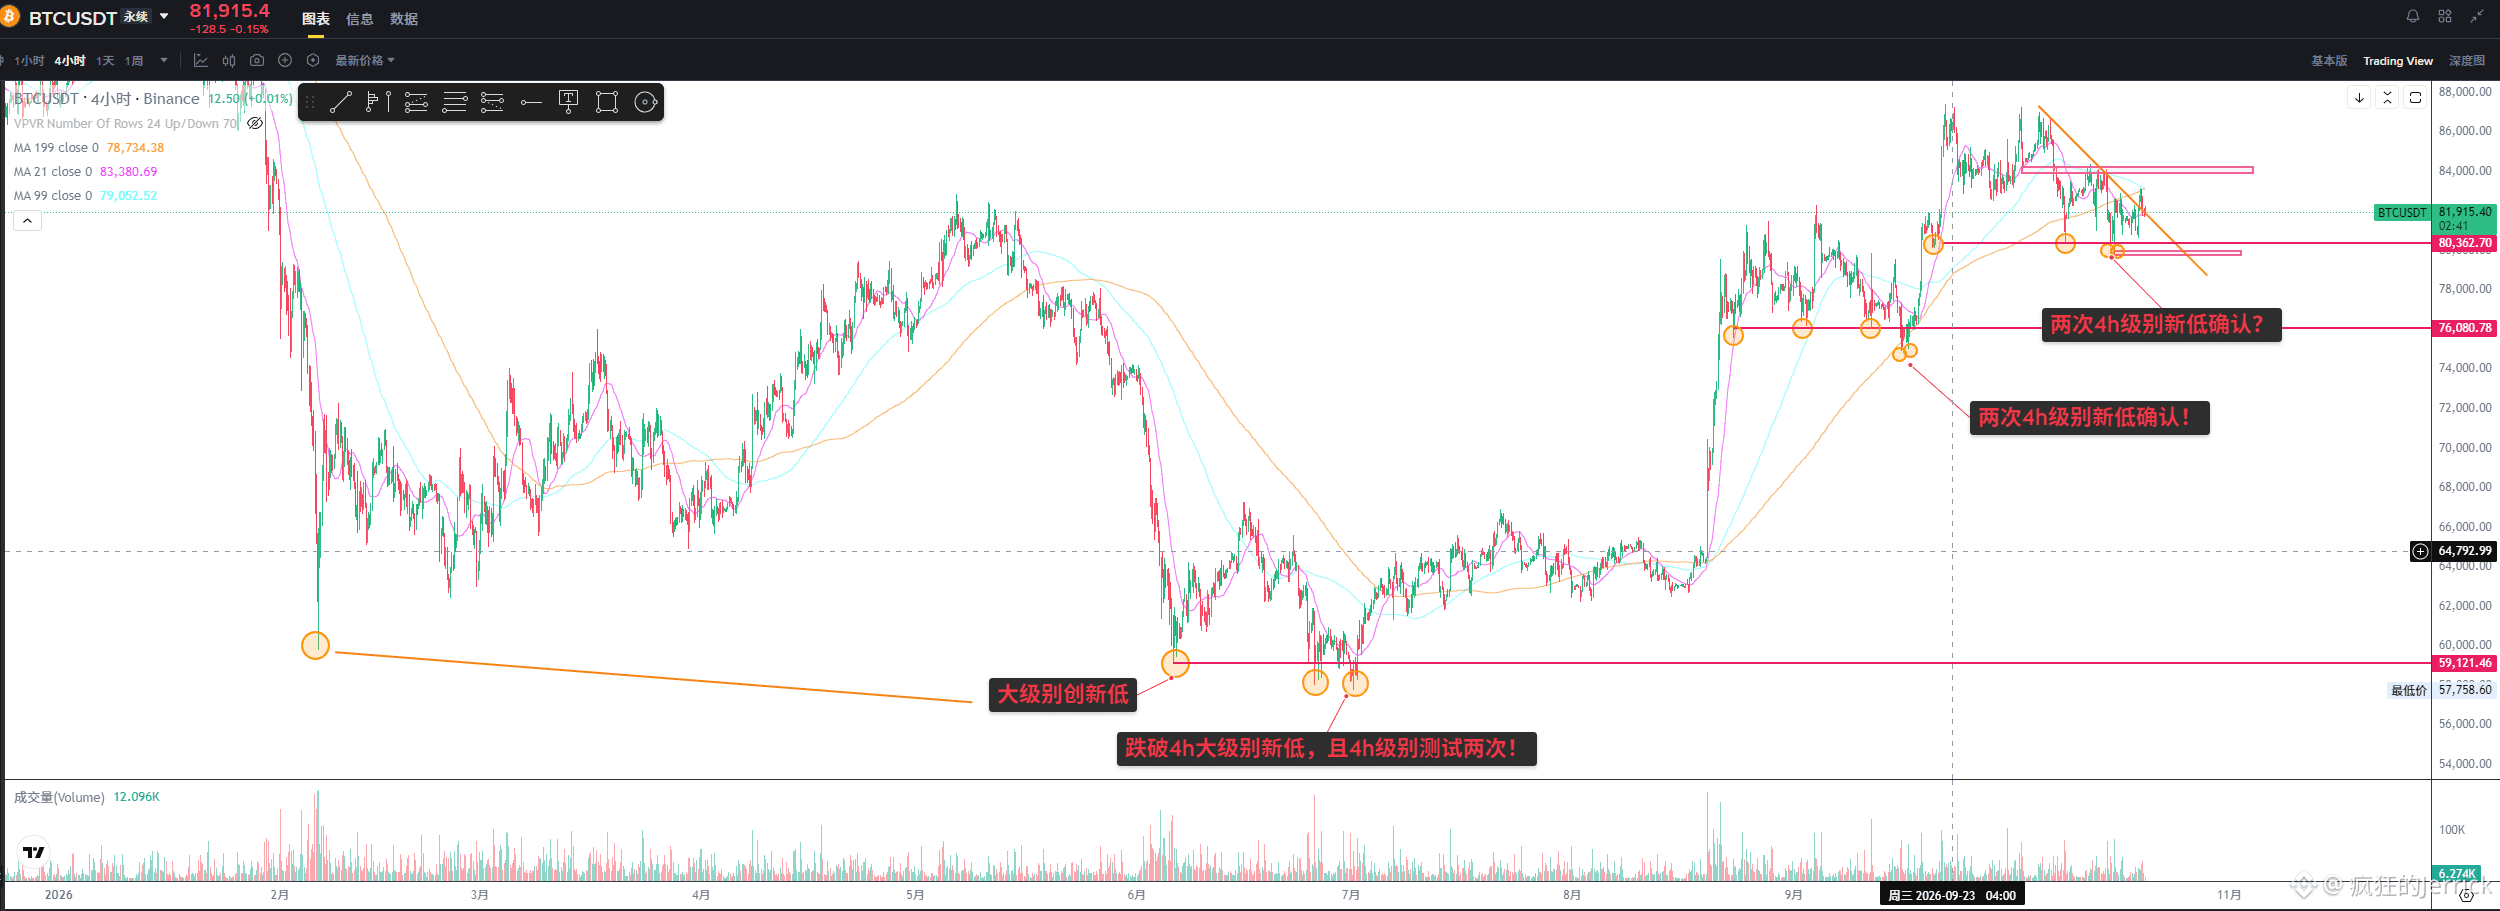
I’ve noticed some patterns in Bitcoin’s price action, and today I’ve gained a new perspective on the market. If you’re interested, feel free to use this as a reference.
1. In the past, we generally looked for a double bottom to confirm a bottom, whether on a larger or smaller time frame. We usually preferred—or felt more confident when—the second bottom was slightly higher than the first. But recently, it seems that major players have been pushing prices below previous lows to take out liquidity, then testing those levels a second time before reversing.
2. Major reversals usually begin only after price makes a new low below a previous major low. This new low generally won’t be much lower than the previous one, but it must be confirmed by at least two tests over a period of four hours or more.
3. The time between the two tests of a reversal low generally depends on the scale of the reversal. The same applies when a new low forms on a larger time frame. This includes both a bull-to-bear reversal and the time frame of a pullback within a bull market. For example, the first bull-to-bear reversal took five days to confirm the new low with two tests. During the second pullback, the correction was shorter, so confirmation also took less time—within two days.
Of course, this is just a study of Bitcoin candlestick patterns, and I haven’t yet looked at other assets. I believe many highly liquid assets may show similar patterns. Feel free to apply these ideas elsewhere, and keep researching, learning, and using them as a reference.
$BTC
Please like and follow. I’ll share all my thoughts for free in the future.