

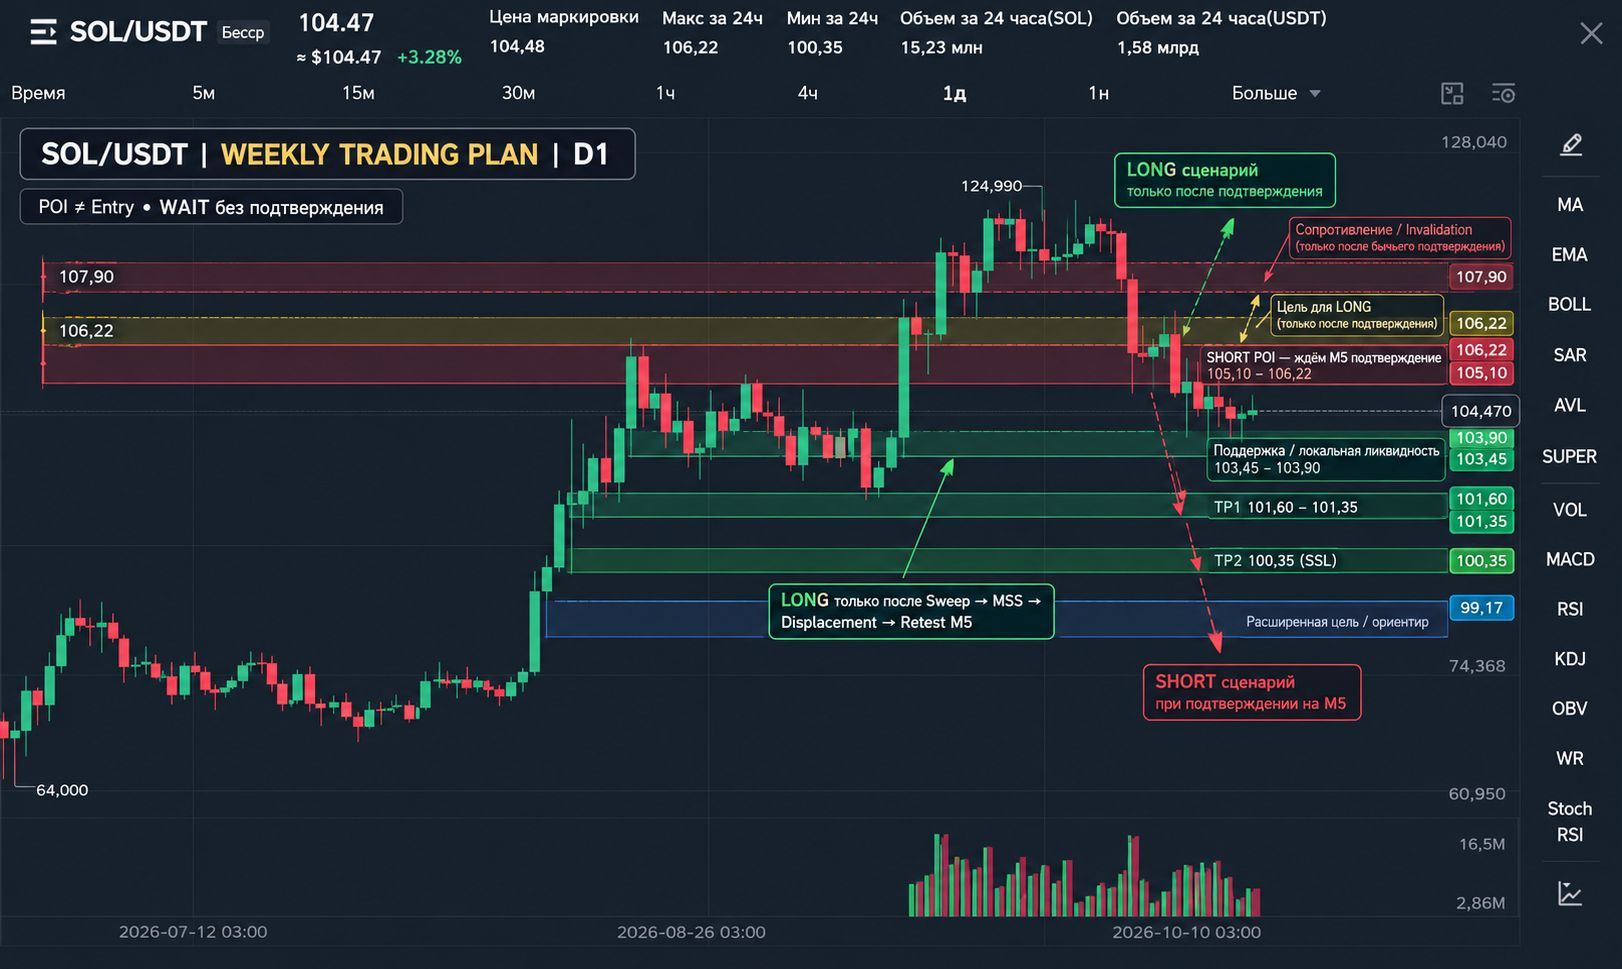
$SOL/USDT — BOUNCE OR CONTINUED DECLINE? Key scenarios for the week
Weekly Trading Plan | October 19, 2026
SOL rebounded from $100.35, but has so far failed to establish itself above $106.22. Buyers have already demonstrated their ability to defend local lows, but sellers continue to cap gains.
The main question this week: will the recovery become the start of a new upward impulse, or will the market use the bounce to continue its downward Delivery?
The answer lies not in the color of the latest candles, but in market structure, liquidity, and confirmation on the lower timeframe.
1. Narrative: where the price came from and where it may go
Higher-timeframe context: recovery after a large-scale decline
The historical SOL chart shows a prolonged downward cycle from the $295.60 area to a low of $60.03. The market later recovered, reaching $124.99, but then began to decline again.
This is important context: the current price around $104.50 is within a recovery move following a large-scale drop, not in a confirmed long-term uptrend.
In the more recent section of the chart, the price rose from $64 to $124.99, then formed a sequence of lower highs and returned to the $100.35 area.
Therefore, for now, the local bounce should be viewed as a recovery within a correction, not as proof of a trend reversal.
Narrative A → B → C
A — what the market has already done.
The price declined to $100.35, swept liquidity below the local lows, and recovered sharply. Buyers then delivered the price to $106.22, where the rise stalled and a new decline began.
B — the main hypothesis for the week.
As long as the structure on the higher working timeframes remains bearish, the priority is to watch for a possible delivery of the price into the $105.10–106.22 area. If a confirmed seller reaction appears there, the next targets could be $103.45, $101.60–101.35, and a retest of $100.35.
C — condition that invalidates the main hypothesis.
If buyers restore the structure and the price holds above $106.22, the bearish scenario will weaken. A firm hold above $107.90 would be stronger evidence that the market may move into a deeper recovery.
Important: this is a scenario model, not a forecast with a guaranteed outcome. The next Delivery must be confirmed by the actual price reaction.
2. Timeframe Hierarchy: W1 → D1 → H4 → H1 → M15 → M5
W1 — global context
Historical highs and lows show the scale of the preceding decline. A recovery from $60.03 to higher levels does not, by itself, prove a long-term trend reversal.
Assessing a global reversal requires additional data on weekly structure and candle closes. Based on the chart provided, it is premature to declare a long-term bull market.
D1 — medium-term structure
After rising to $124.99, the price began to decline. The important local high at $106.22 has not yet been overcome, and recovery attempts have been followed by sellers returning.
The medium-term context remains vulnerable until the market recovers the nearest resistance levels and forms a stronger upward structure.
H4 — working directional Bias
The current H4 section shows a series of lower highs after the $123.77 area. The latest bounce from $100.35 has not yet led to a sustained breakout above $106.22.
Working Bias: bearish, but conditional.
This means SHORT takes priority if confirmed; it does not mean a position should be opened immediately.
H1 — local structure
On H1, a sharp rise from $100.35 followed by a decline is visible. The $105.10–106.22 area is the nearest resistance, while $103.45–103.90 represents local support.
The market is between these levels. Until there is a confirmed breakout and hold, the direction of the next impulse remains uncertain.
M15 — scenario preparation
On M15, the price has repeatedly changed direction within the local range. The rise from $100.35 was accompanied by strong green candles, but the price did not continue higher above $106.22.
At this stage, the task is to watch for an approach to liquidity and the reaction within the POI, rather than trying to predict the next impulse.
M5 — execution
On the lower timeframe, wait for the full sequence:
Liquidity Sweep → MSS → Displacement → FVG/IFVG Retest.
Without this sequence, there is no basis for considering the POI a ready entry point.
3. Key Levels and Liquidity
Key reference levels in the current structure:
$107.90 — the upper boundary of the nearest extended resistance.
$106.22 — the local high and Buy-side Liquidity area.
$105.10–105.50 — the nearest zone of potential seller reaction.
$104.50–104.60 — the current price area on the provided screenshots.
$103.45–103.90 — local support and potential Sell-side Liquidity.
$101.60–101.35 — an intermediate support area.
$100.35 — the last marked low and an important liquidity reference.
$99.17 — the next visible price reference if $100.35 breaks.
These levels are taken from the provided charts. They mark areas to watch, not confirmed reversal points.
What happened with liquidity?
The most obvious event was the move toward $100.35 followed by a recovery. This is consistent with a sweep of Sell-side Liquidity below the local lows.
The price then reached $106.22, where the rise stalled. This high forms the nearest Buy-side Liquidity reference.
However, a liquidity sweep alone does not determine the next direction. It shows where the market may have collected liquidity; the direction of the next Delivery needs to be confirmed by the structure.
4. Dealing Range: Premium and Discount
For the working model, we use the $100.35–106.22 range.
Lower boundary: $100.35.
Upper boundary: $106.22.
Equilibrium: approximately $103.29.
Discount: below $103.29.
Premium: above $103.29.
At around $104.55, SOL is trading above the midpoint of the range, meaning it is in Premium relative to this working model.
This makes looking for a SHORT after a confirmed reaction in the upper part of the range a logical option. But Premium is not a sell signal on its own: without a Sweep, MSS, Displacement, and retest, no entry is considered.
Similarly, Discount does not mean an automatic buy. A LONG requires buyer confirmation.
5. Main Scenario — Plan A: SHORT
Hypothesis: the local recovery will end, and the market will continue its downward Delivery.
POI
Area to watch: $105.10–106.22.
In this zone, the price may test local supply and liquidity above the intermediate highs. But touching the POI does not confirm the presence of sellers and is not an entry signal.
What do we need to see?
The price is delivered into the POI.
Local Buy-side Liquidity is swept.
A bearish MSS forms on M5.
A clear downward Displacement appears.
The price returns to the formed FVG/IFVG and confirms a seller reaction.
Only after this sequence can Entry, SL, and potential targets be assessed.
Expected Delivery
With a confirmed SHORT, the first target to watch is $103.45.
If the impulse continues, the next reference levels are $101.60–101.35, followed by $100.35.
If the price breaks $100.35 and holds below it, the next visible reference on the chart shown is the $99.17 area.
This is a sequence of potential targets, not a claim that the market will necessarily reach each one.
Invalidation
A sustained recovery above $106.22 weakens the main hypothesis. A hold above $107.90 would be a more significant sign that the current bearish model has been invalidated.
The actual Stop Loss should be determined from the M5 structure after a confirmed setup forms, rather than placed arbitrarily at one of the higher-timeframe levels.
6. Alternative Scenario — Plan B: LONG
Hypothesis: sellers will be unable to continue the decline, and a liquidity sweep to the downside will provide the basis for a new upward impulse.
POI
The main area to watch is $103.45–103.90.
If selling pressure intensifies, attention shifts to $101.60–101.35 and then $100.35.
These zones do not guarantee a bounce. Their purpose is to identify where to look for a reaction if the price continues to decline.
Confirmation conditions
For a LONG, we need to see:
A sweep of Sell-side Liquidity below the local low.
A bullish MSS on M5.
A clear upward Displacement.
A return to the FVG/IFVG and a confirmed retest.
Without these conditions, buying remains speculative.
Expected Delivery
With a confirmed bullish scenario, the nearest targets are $105.10–105.50, followed by $106.22.
If the price recovers $106.22 and holds above it, the next area to watch is $107.90.
A resistance breakout should be accompanied by confirmed structure. A single upward impulse does not mean the market has definitively changed direction.
Invalidation
For a specific LONG setup, the critical level is the low formed during the liquidity sweep. If the price loses this low without restoring bullish structure, the original model is no longer valid.
If the price continues to decline toward $100.35, the market reaction needs to be reassessed. The previous LONG scenario cannot automatically be carried over to the new structure.
7. FTA / TA: where to assess the move’s outcome?
For SHORT:
FTA — $103.45, the nearest zone where buyers may react.
Next target — $101.60–101.35.
Deeper target — $100.35.
For LONG:
FTA — $105.10–105.50.
Next target — $106.22.
On a confirmed breakout — $107.90.
FTA is the first area where the price may stall or change behavior. TA is the subsequent target if the impulse continues.
Before entry is confirmed, these levels are used for planning only. RR cannot be calculated without a specific Entry and structural SL.
8. Risk Management and Execution Discipline
At the time of analysis, the price is around $104.50–104.60 — between the nearest support and resistance zones.
Entering a SHORT at the current price may mean selling before the price reaches the presumed supply zone. Entering a LONG without confirmed bullish structure means trying to catch the continuation of a bounce against a weaker higher-timeframe context.
Both options carry the risk of entering without sufficient confirmation.
Therefore:
do not open a position just because the price touches the POI;
do not chase an impulse after a strong candle;
do not substitute an assumption of a reversal for MSS;
do not set Entry, SL, TP, and RR before a setup forms;
assess the potential risk-to-reward ratio after a confirmed entry point appears.
Current status: WAIT.
The provided screenshots do not offer sufficient grounds to declare a ready entry in either SHORT or LONG.
Conclusion: what really matters this week?
SOL swept liquidity to the downside around $100.35 and recovered to $106.22, but failed to hold above that high. The subsequent decline leaves sellers with the advantage in the current working structure.
The main scenario is to look for a confirmed SHORT after a return to $105.10–106.22. The alternative is a LONG after a downside liquidity sweep and the formation of bullish M5 structure.
The main principle remains unchanged: liquidity first, then confirmation of structure, then entry. Not the other way around.
If the market provides no confirmation, staying out of a trade is the right decision.
Question for the community: which scenario do you think is more likely for SOL this week — a continued decline toward $100.35 or a recovery above $106.22? Share your scenario and specify the level that would confirm your hypothesis.
#SOL #SOLUSDT #TradingPlan #BinanceSquare #CryptoTrading